Historical scope reviewed September 8, 2026. The effective-sample estimates describe the historical payout series and its target overlap. They are statistical approximations, not a literal count of independent fund bets. Individually funded atomic positions do not remove outcome dependence, and the 60-day target needs a new estimate. See the current metric definitions.
Numerai's daily cadence manufactures sample size that isn't there. The pool's 762 resolved daily rounds since October 2022 carry the statistical information of about 31 independent bets, a 24-fold deflation, and the median staked model's own track record deflates by roughly 10×. If you have ever changed your stake because of a bad month, this article is about why that month contained perhaps two genuine observations, and what a real evaluation horizon looks like.
None of this is a scoring bug. It follows from one design fact: a new round opens every weekday, and each one is scored on the following 20 trading days of market data. Two rounds one day apart share 19 of their 20 scoring days. They are almost the same bet, placed twice.
Every round is mostly yesterday's round
The exhibit below draws the scoring window of 60 consecutive daily rounds, close to payout resolution. The highlighted round overlaps 35 neighbours; every bar crossing its span is exposed to the same slice of the market.
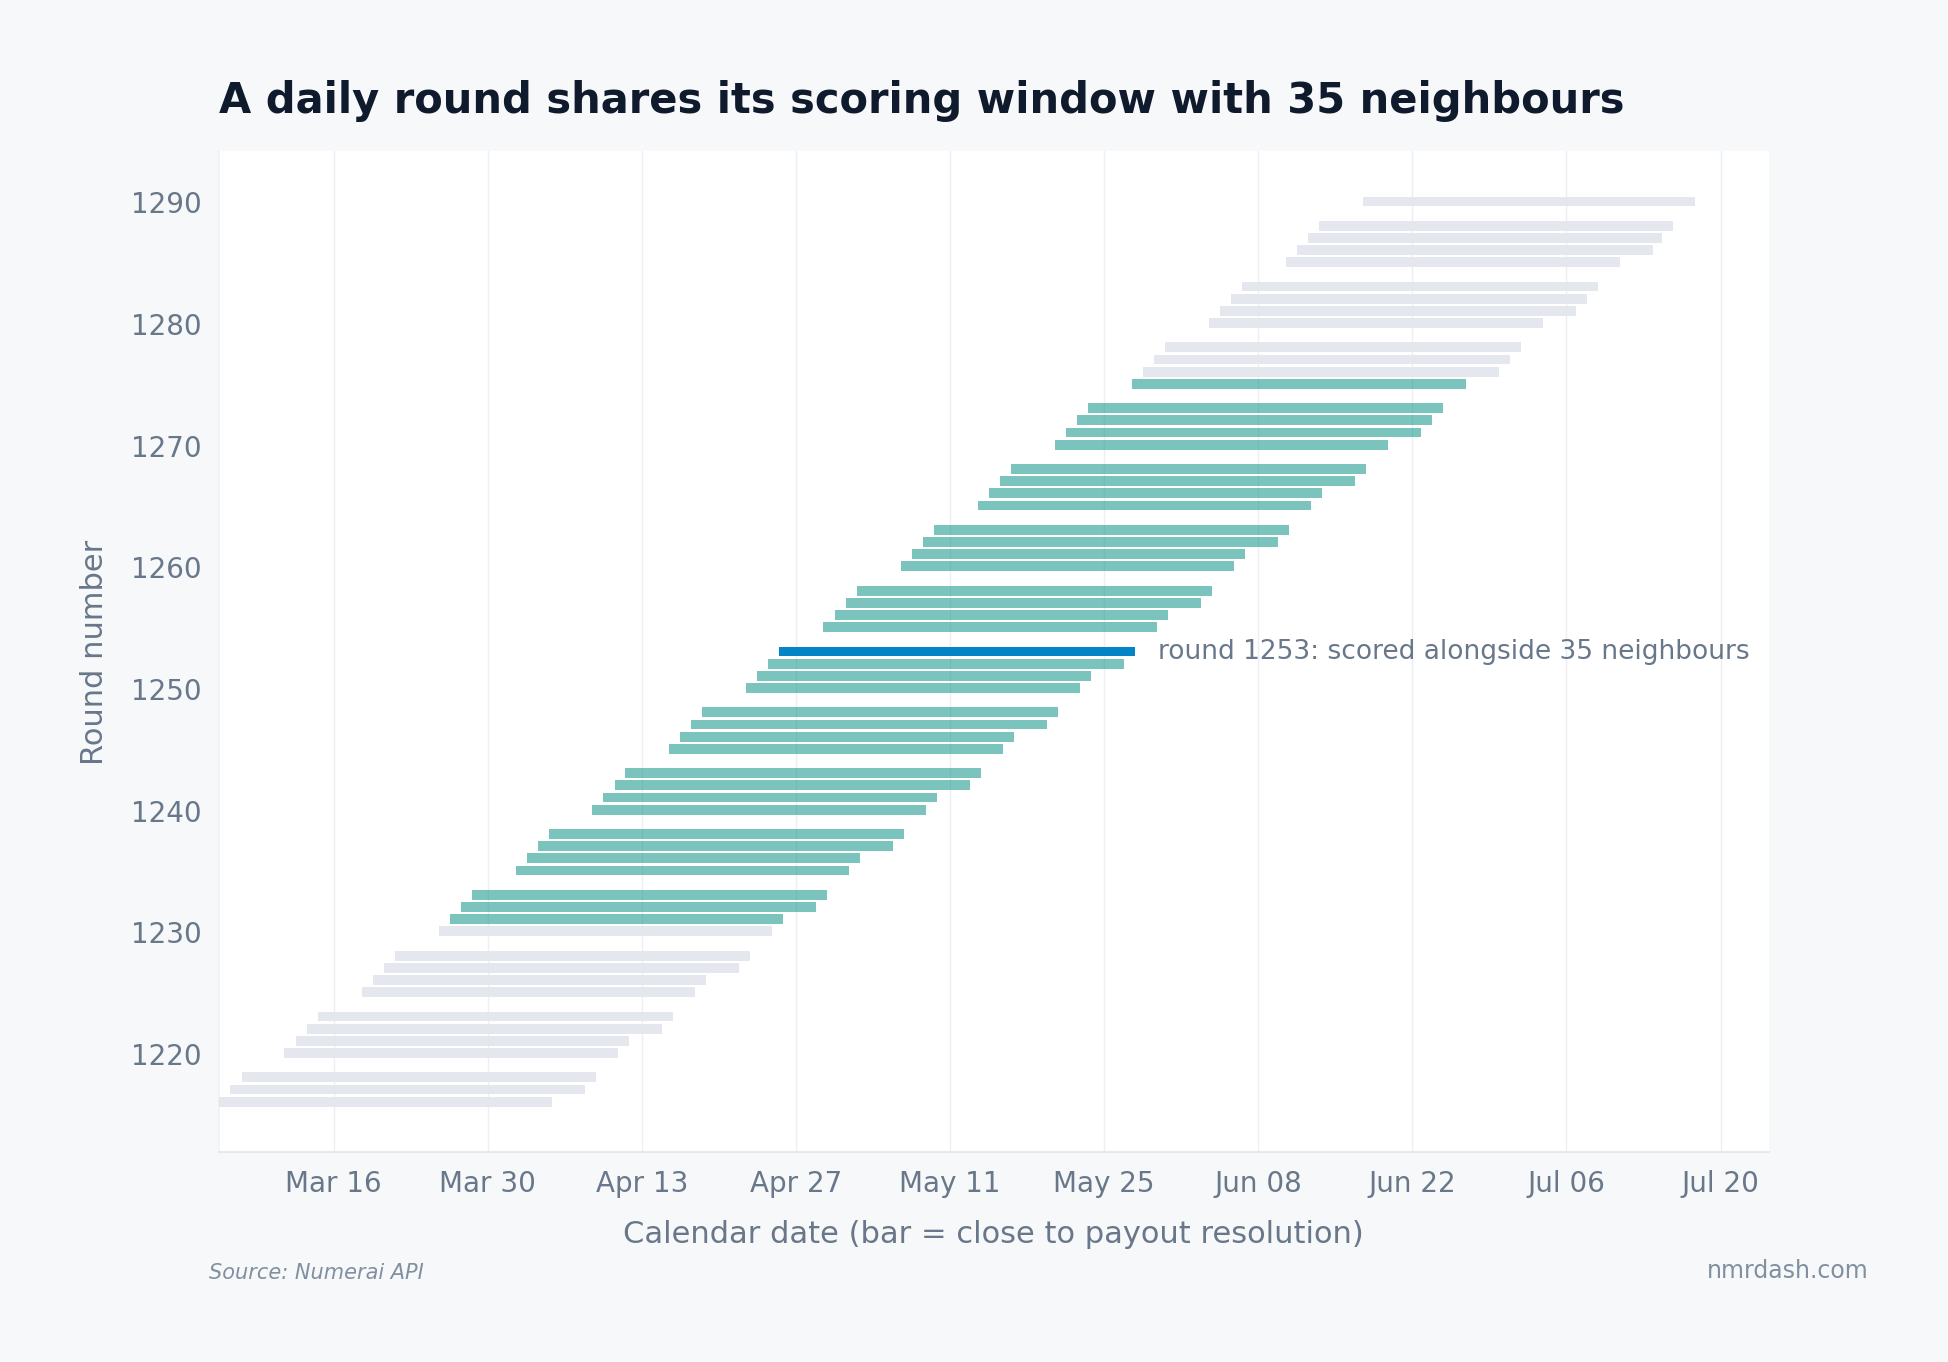
When the market has a bad three weeks, it doesn't hit one round. It hits every round whose window touches those weeks, which is roughly a month's worth in each direction. The payout formula then settles each of those rounds against the same drawdown.
The correlation is 85% one day out and never quite dies
Measured on net pool payout per unit of stake (earned minus burned, over total at risk), adjacent daily rounds correlate at 0.85. The autocorrelation decays roughly linearly across the shared 20-trading-day window, exactly as mechanical overlap predicts, and then refuses to reach zero: from lag 20 out to lag 30 it floors near 0.15–0.2.
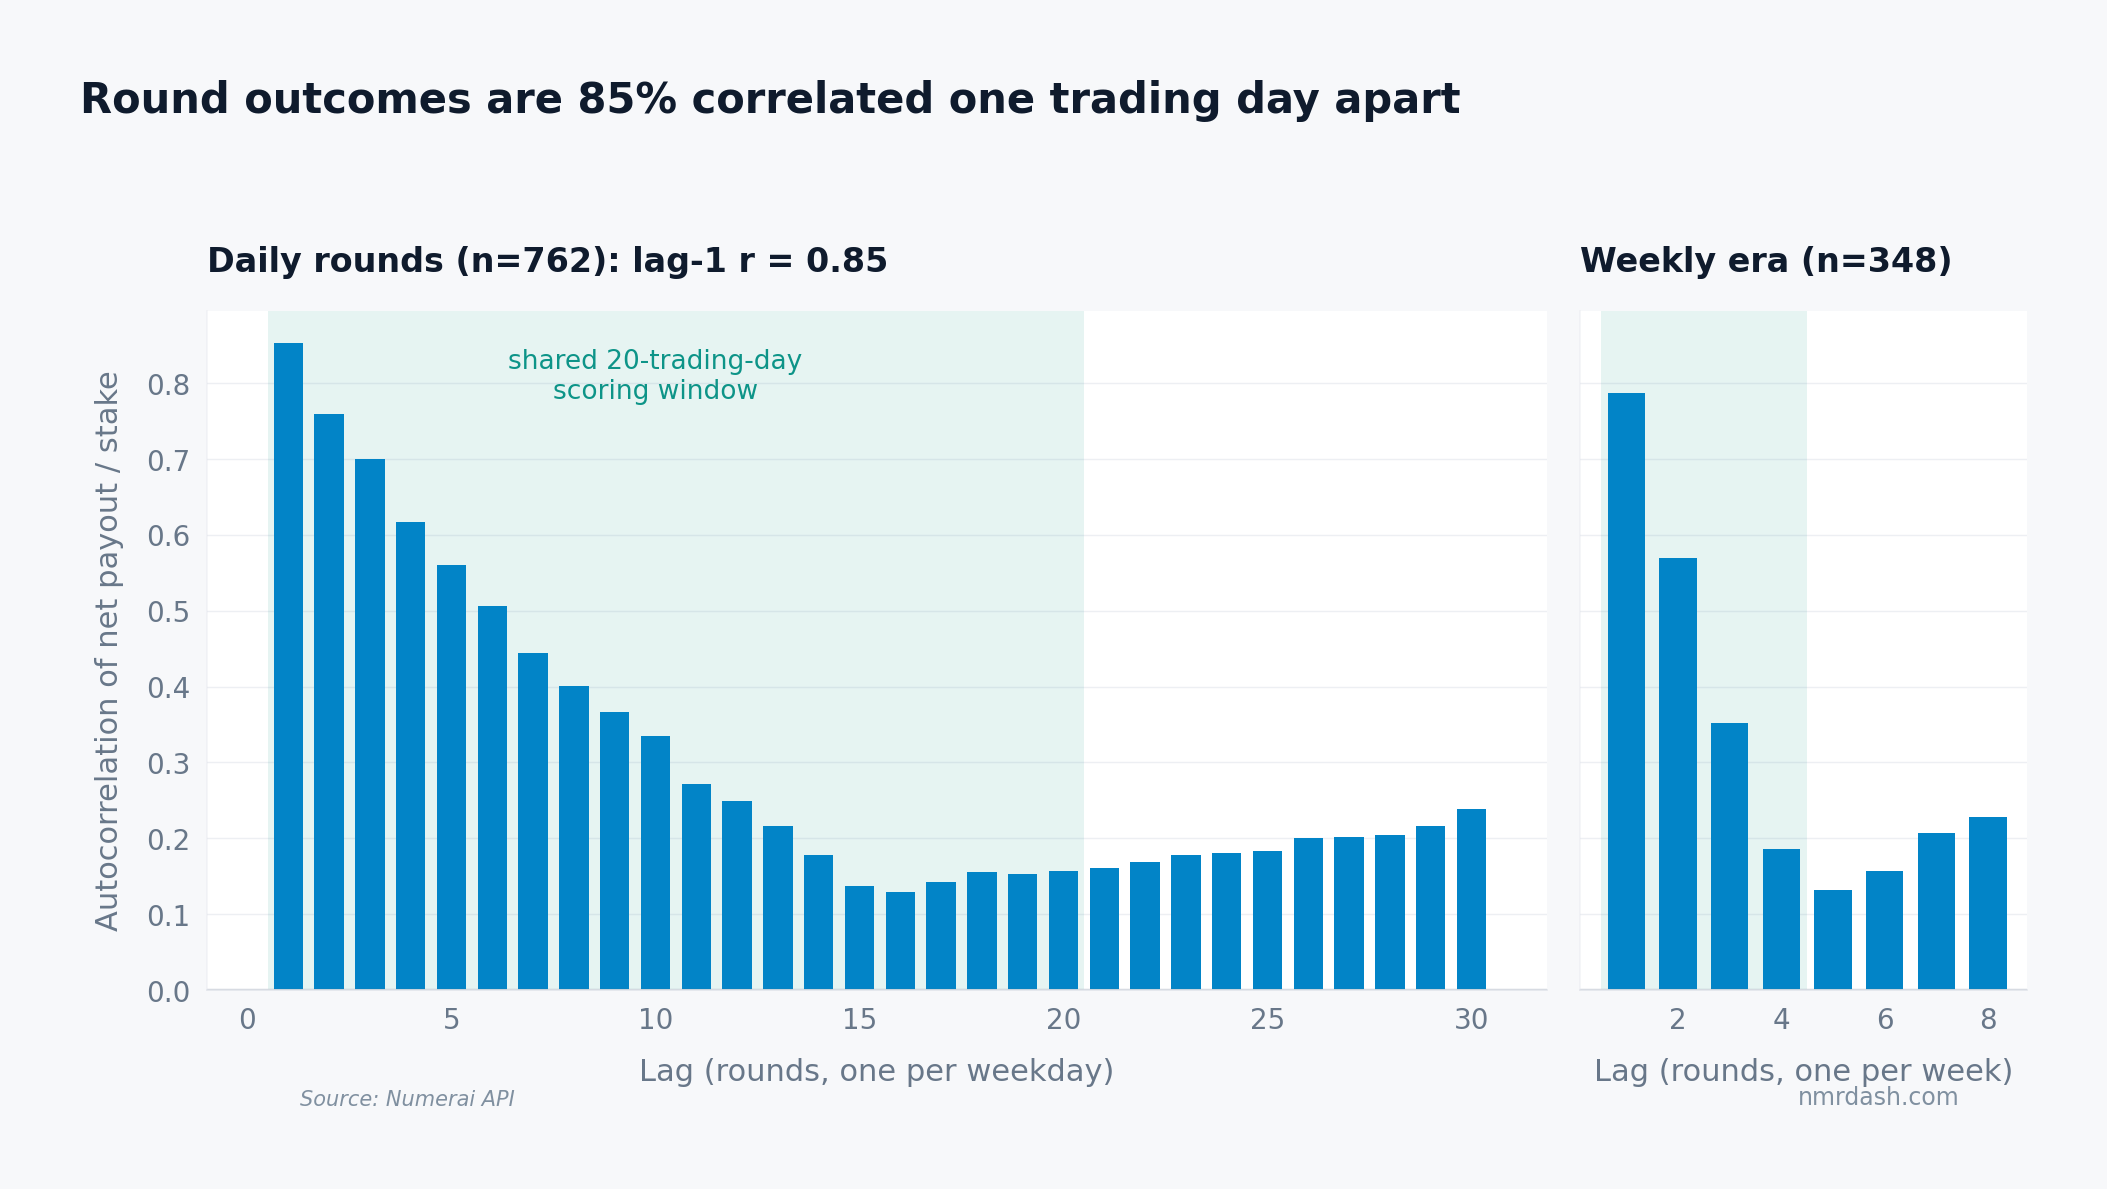
That floor is the part overlap cannot explain. It is regime persistence, the same force behind the clustered failures in the burn rounds analysis: quant-unfriendly markets last months, not days. Pure window overlap would cap the sample-size deflation near 21×; the measured figure is 24× because burn seasons stack on top of the mechanics. The weekly era (348 rounds, one per week over four-week windows) shows the same shape compressed: lag-1 of 0.79, fading past lag 4.
Fold the correlation structure into an effective sample size and the numbers turn stark. The daily era's 762 rounds are worth about 31 independent observations; the entire weekly era adds about 22 more. Nine years of tournament history, roughly 1,100 resolved rounds, amount to something like 50 effective observations under this historical payout-series estimator.
Burn streaks are the overlap made visible
A 20-round stretch of daily rounds carries about 12× the variance that independent rounds would produce — swings 3.4× larger than a naive √N estimate. And the variance ratio keeps climbing past the mechanical window instead of plateauing, which is the regime component again.
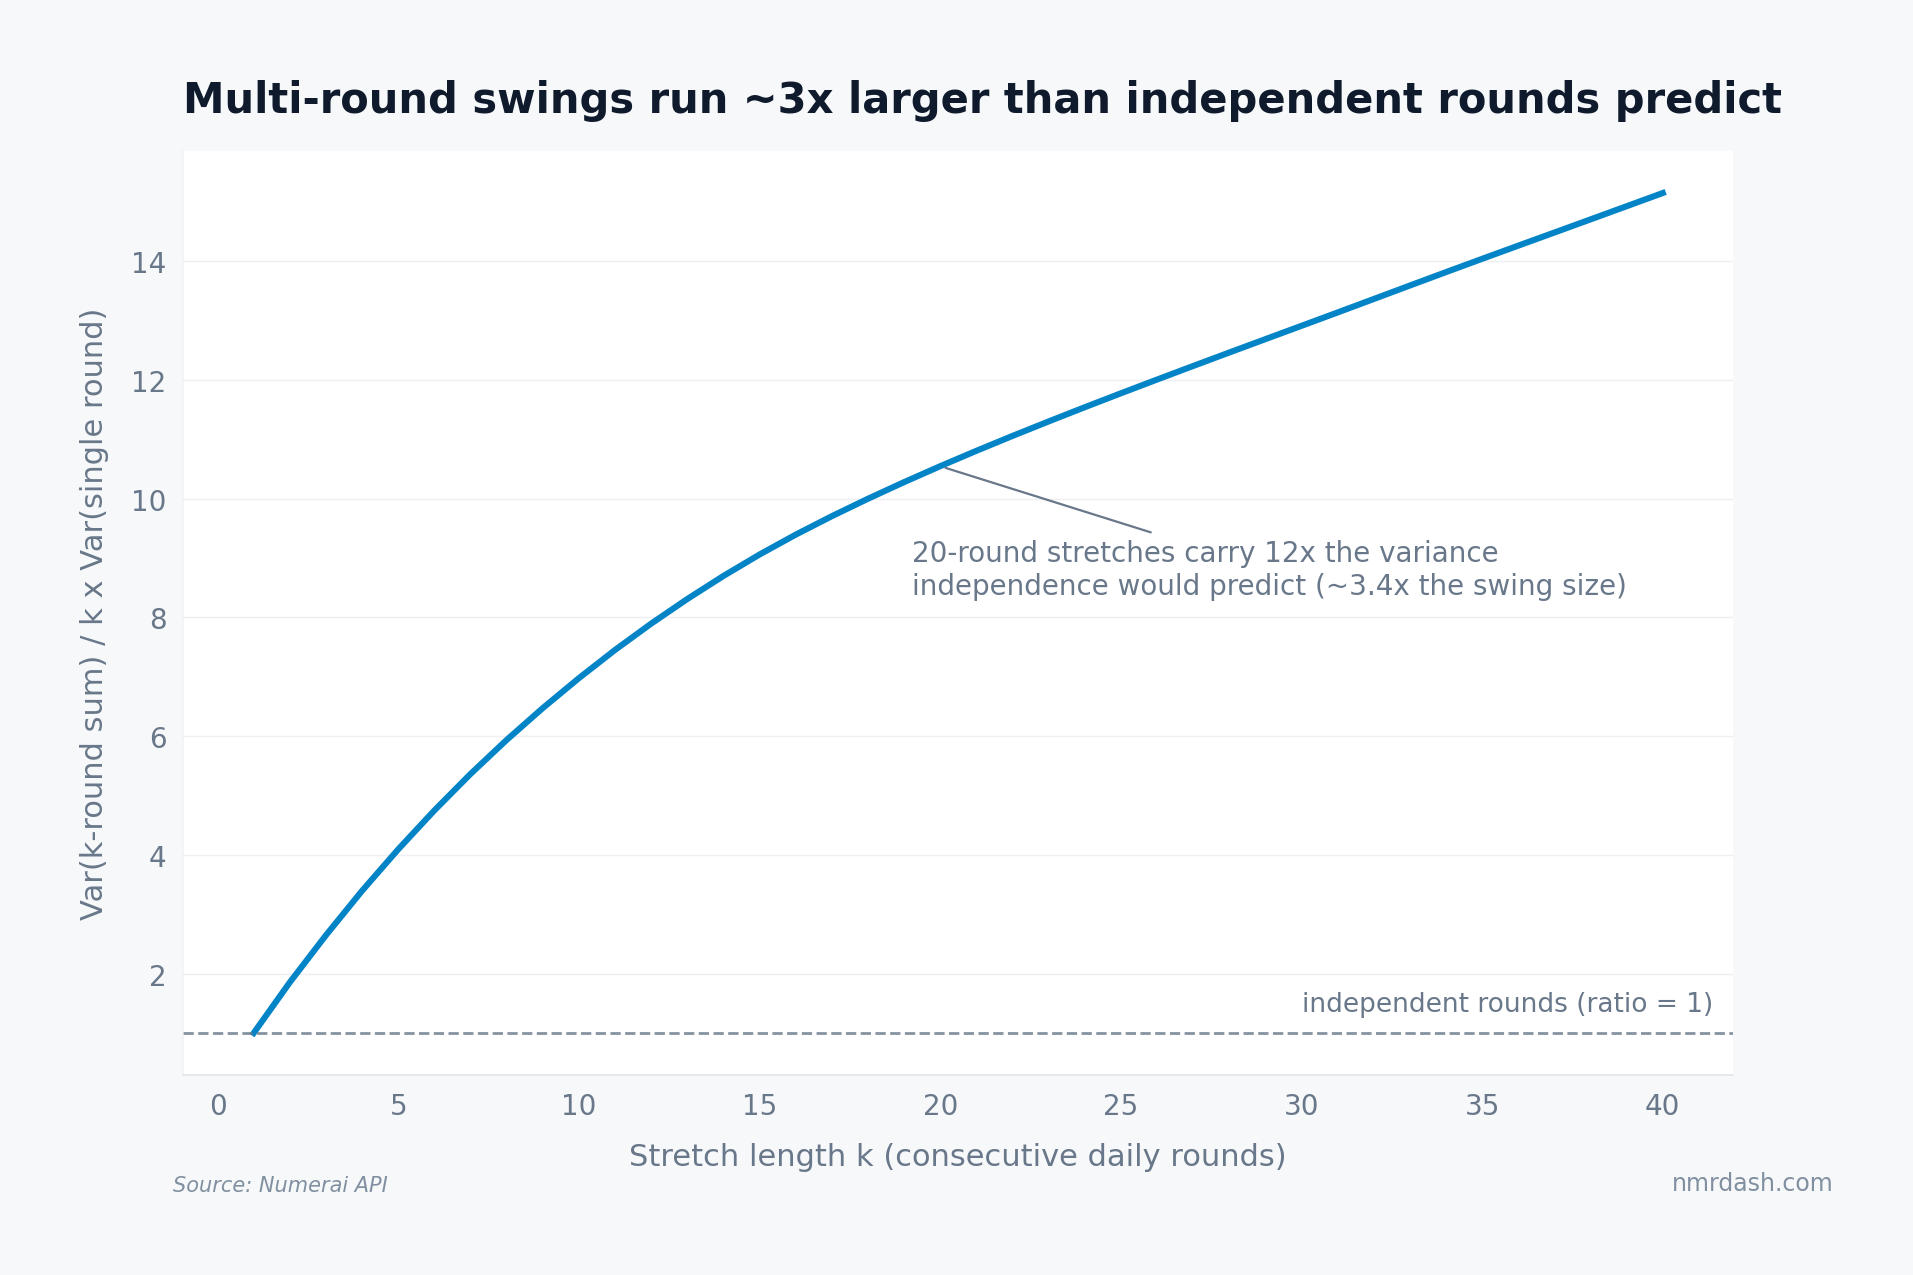
The clearest casualty of treating rounds as independent is streak intuition. The longest run of consecutive net-burn daily rounds on record is 15. Shuffle the same outcomes into random order and the longest streak is typically 3, and almost never longer than 4. The historical streaks are longer than a shuffled comparison. That comparison demonstrates dependence; it does not identify the cause of any particular streak.
I read this as the missing mechanism in two earlier posts. The burn-streak league table documented that losses cluster; this is why, and it says clusters of this size are the expected texture of the series. It also reframes return persistence: a model can look brilliant for 40 straight rounds while logging four genuine data points.
Divide your track record by ten before trusting it
Pool-level redundancy is 24×, but a staker judging one model should use the model-level number: across 2,325 staked models with at least 100 resolved daily rounds at 10+ NMR, the median deflation of a model's own payout series is about 10×. A 250-round year of your model is ~25 independent observations.
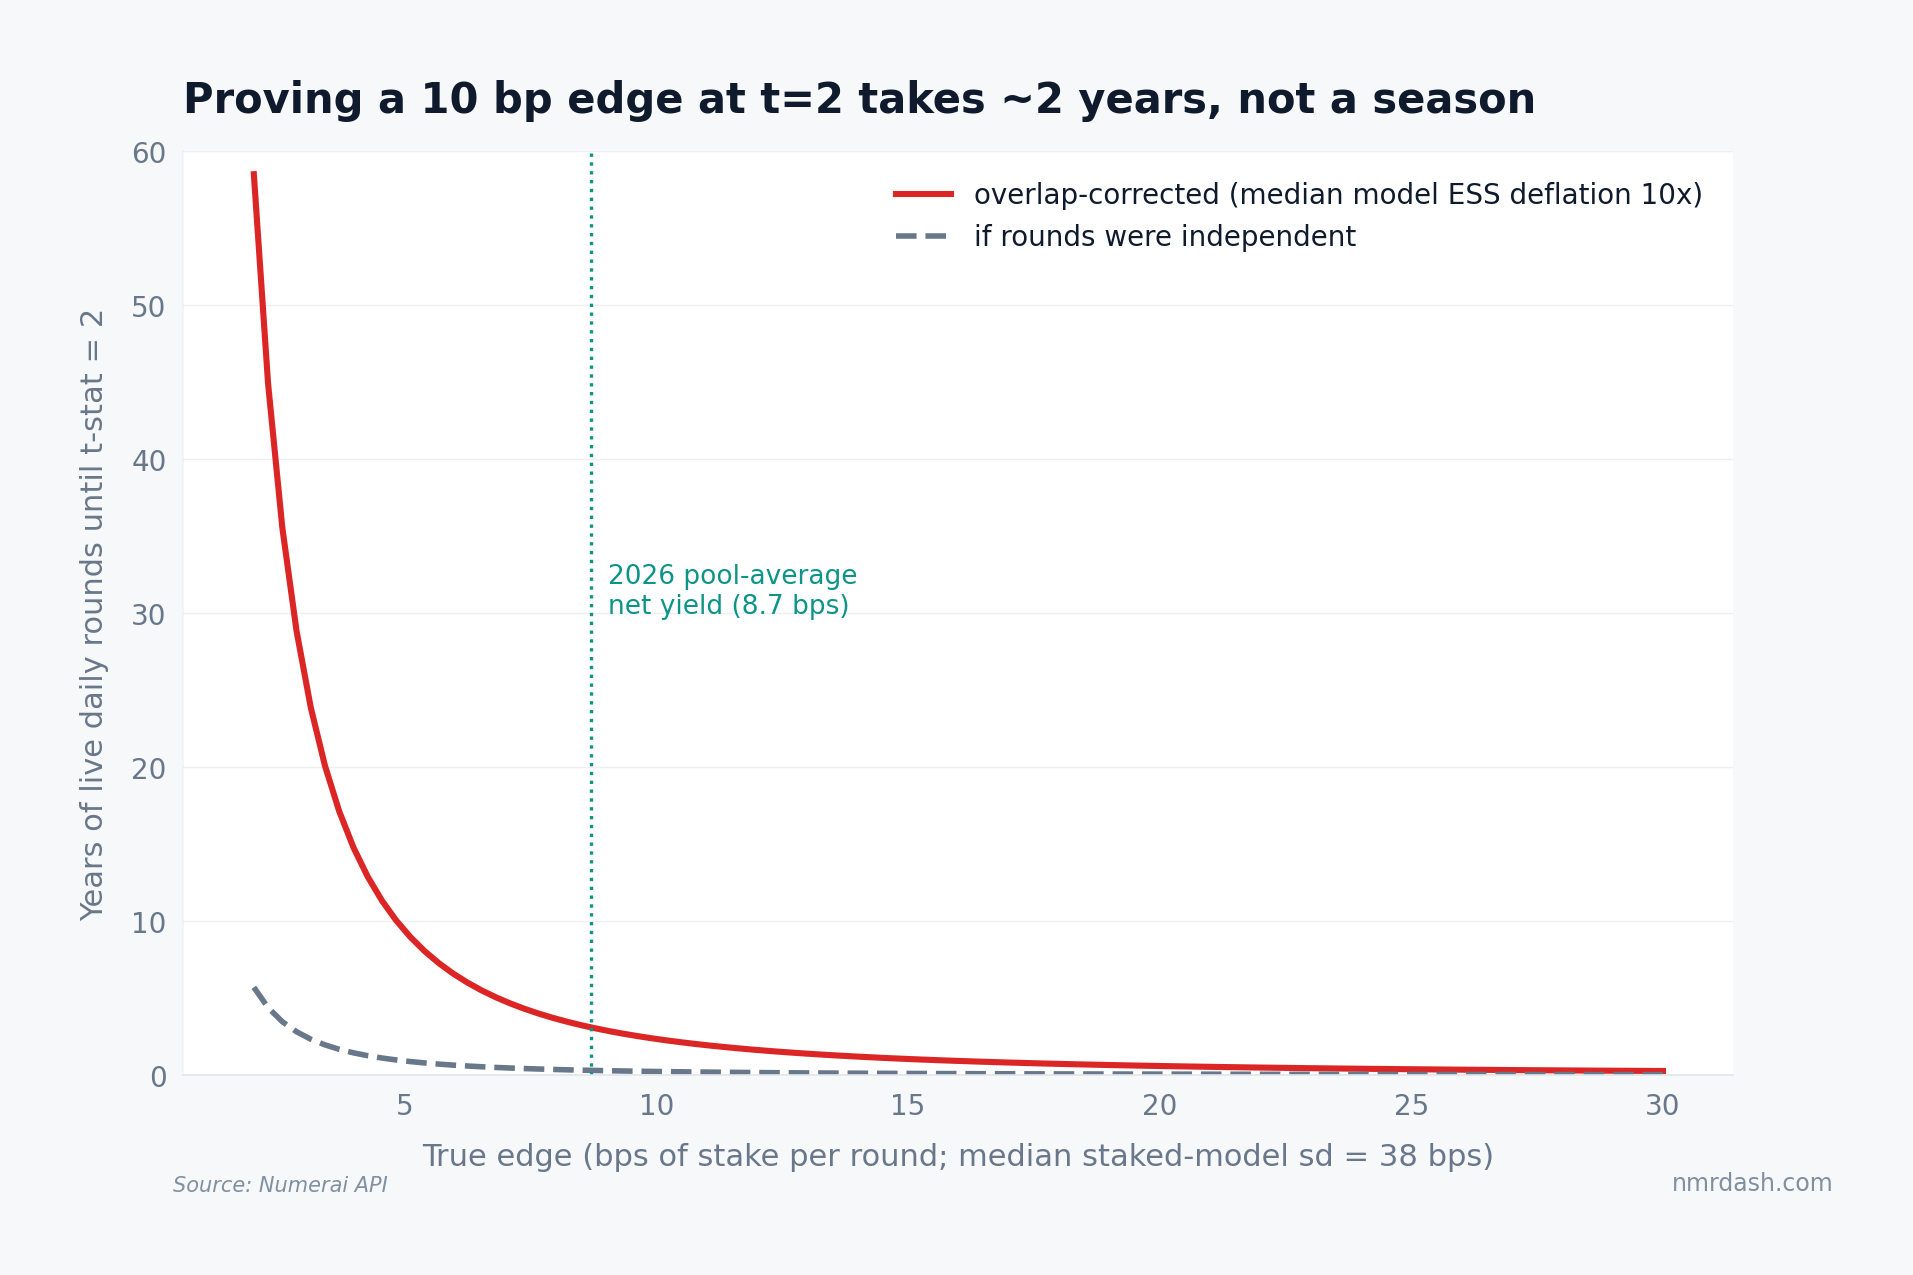
The detection math follows. The median staked model's per-round payout volatility is 38 bps of stake, so distinguishing a true 10 bp per-round edge from zero at a t-stat of 2 needs about 58 independent observations — call it 600 daily rounds after the 10× correction, or two and a half years of continuous live submission.
Edges near the pool's 2026 average net yield of 8.7 bps (the compressed regime) take about three years to certify. A 5 bp edge is effectively unprovable inside a model's useful lifetime.
Three practical readings, each priced off the numbers above. A quarter of live results (~62 rounds, ~6 effective observations) cannot tell a 10 bp model from a lucky zero-edge one, so acting on quarterly performance is acting on noise. Sizing for variance means sizing for 3.4× the swings that independent-round intuition suggests, which is the same lesson the volatility tax reached from the compounding side. And when comparing two of your own models, comparing them on the same rounds cancels the shared regime term, which is opinion but mechanically motivated: the correlation being common-mode is precisely what the ACF floor shows.
What would change this read
Two things, both watchable. First, a payout-metric change: if Numerai shortened the scored horizon, the mechanical overlap would shrink proportionally, and the lag structure in the ACF chart would show it within a quarter. A move the other way — paying on 60-day metrics like CORJ60 — would triple the window and make everything here worse. Second, a genuine break in the regime floor: if the lag-20+ autocorrelation collapsed toward zero for a sustained stretch, effective sample sizes would improve by roughly a fifth, and burn streaks should shorten toward their iid distribution. Until one of those happens, I treat any Numerai performance claim measured in months as unproven, including my own.
Method notes: Classic tournament (8) only; resolved rounds with positive stake as of the 2026-07-20 ingest. Pool series is (total earned − |total burned|) / total at stake; daily era spans round closes from 2022-10-26 to 2026-06-17 (n=762), weekly era n=348. Effective sample size uses N / (1 + 2Σρₖ) with the sum truncated at the first negative lag. Per-model panel: settled payouts at ≥10 NMR stake, ≥100 resolved daily rounds, benchmark rows excluded; the 10.3× median deflation is computed over models with ≥200 rounds. The detection chart assumes a constant true edge and volatility over the horizon, which flatters the result: real edges decay. Variance ratios use overlapping k-round sums.