How Deep Do Numerai Model Drawdowns Run?
Across 2,349 long-lived staked Numerai models, the median worst drawdown is 19% of stake, half are never recovered, and the best earners drew down deepest.
Every serious Numerai staking plan needs one number the marketing never mentions: how far below its high-water mark your model will someday sit. Across the 2,349 Classic models with at least 150 settled staked rounds at 10+ NMR, the median career-worst drawdown is 19 percentage points of stake. The planning number is worse: the worst decile of these long-lived models lost 55 points of stake peak-to-trough. And as of July 2026, with the field's MMC at record lows, 86% of these track records sit below their own high-water mark.
Pool-level burn streaks get the attention, but a staker doesn't experience the pool. They experience one cumulative payout curve, and this note is the census of how bad those curves get.
The base rate is a fifth of your stake
For each model I built its cumulative per-round return path (settled payout over stake at risk, summed round by round) and took the deepest peak-to-trough fall. Half of all long-lived models have endured a 19-point loss of stake or worse; a quarter have been through 34 points or worse.
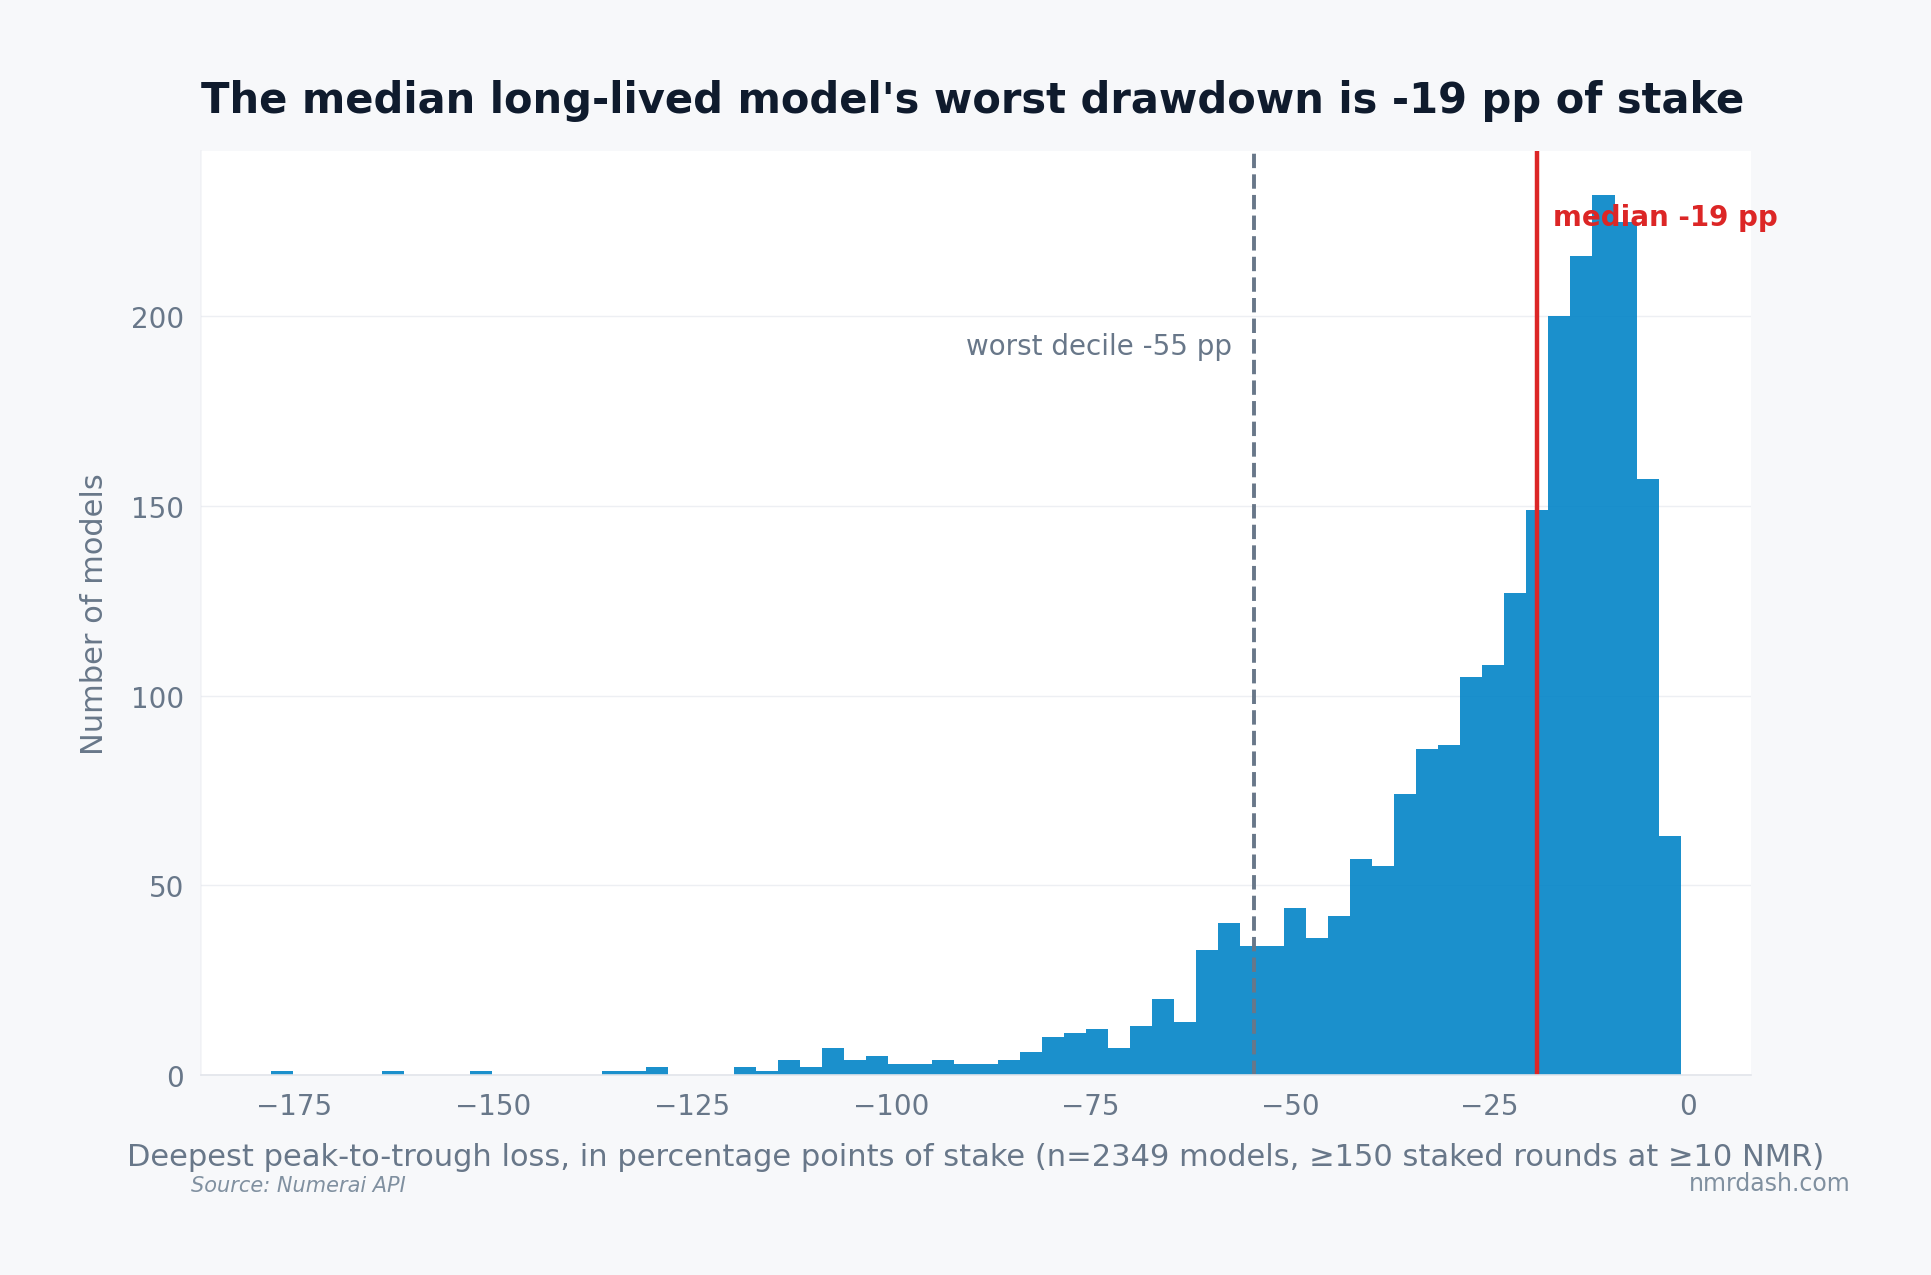
The tail deserves respect: dozens of careers have shed more than a full stake's worth of cumulative payouts from peak (possible because burns repeat round after round on a stake that keeps being refilled by earlier winnings). If your reaction to a 20-point drawdown would be to unstake, the base rates say you will exercise that reaction on most models you ever run; the median peak-to-trough leg alone lasts 56 rounds, which at a 10× overlap deflation is only about five independent draws. Quitting there is usually pricing a coin flip as a trend.
Half of the worst drawdowns are never repaid
Of the 2,349 career-worst drawdowns, 52% had not been recovered by the model's last staked round. Among the 1,127 that did climb all the way back, the median round-trip from trough to prior peak took 35 rounds; the slowest took over 700.
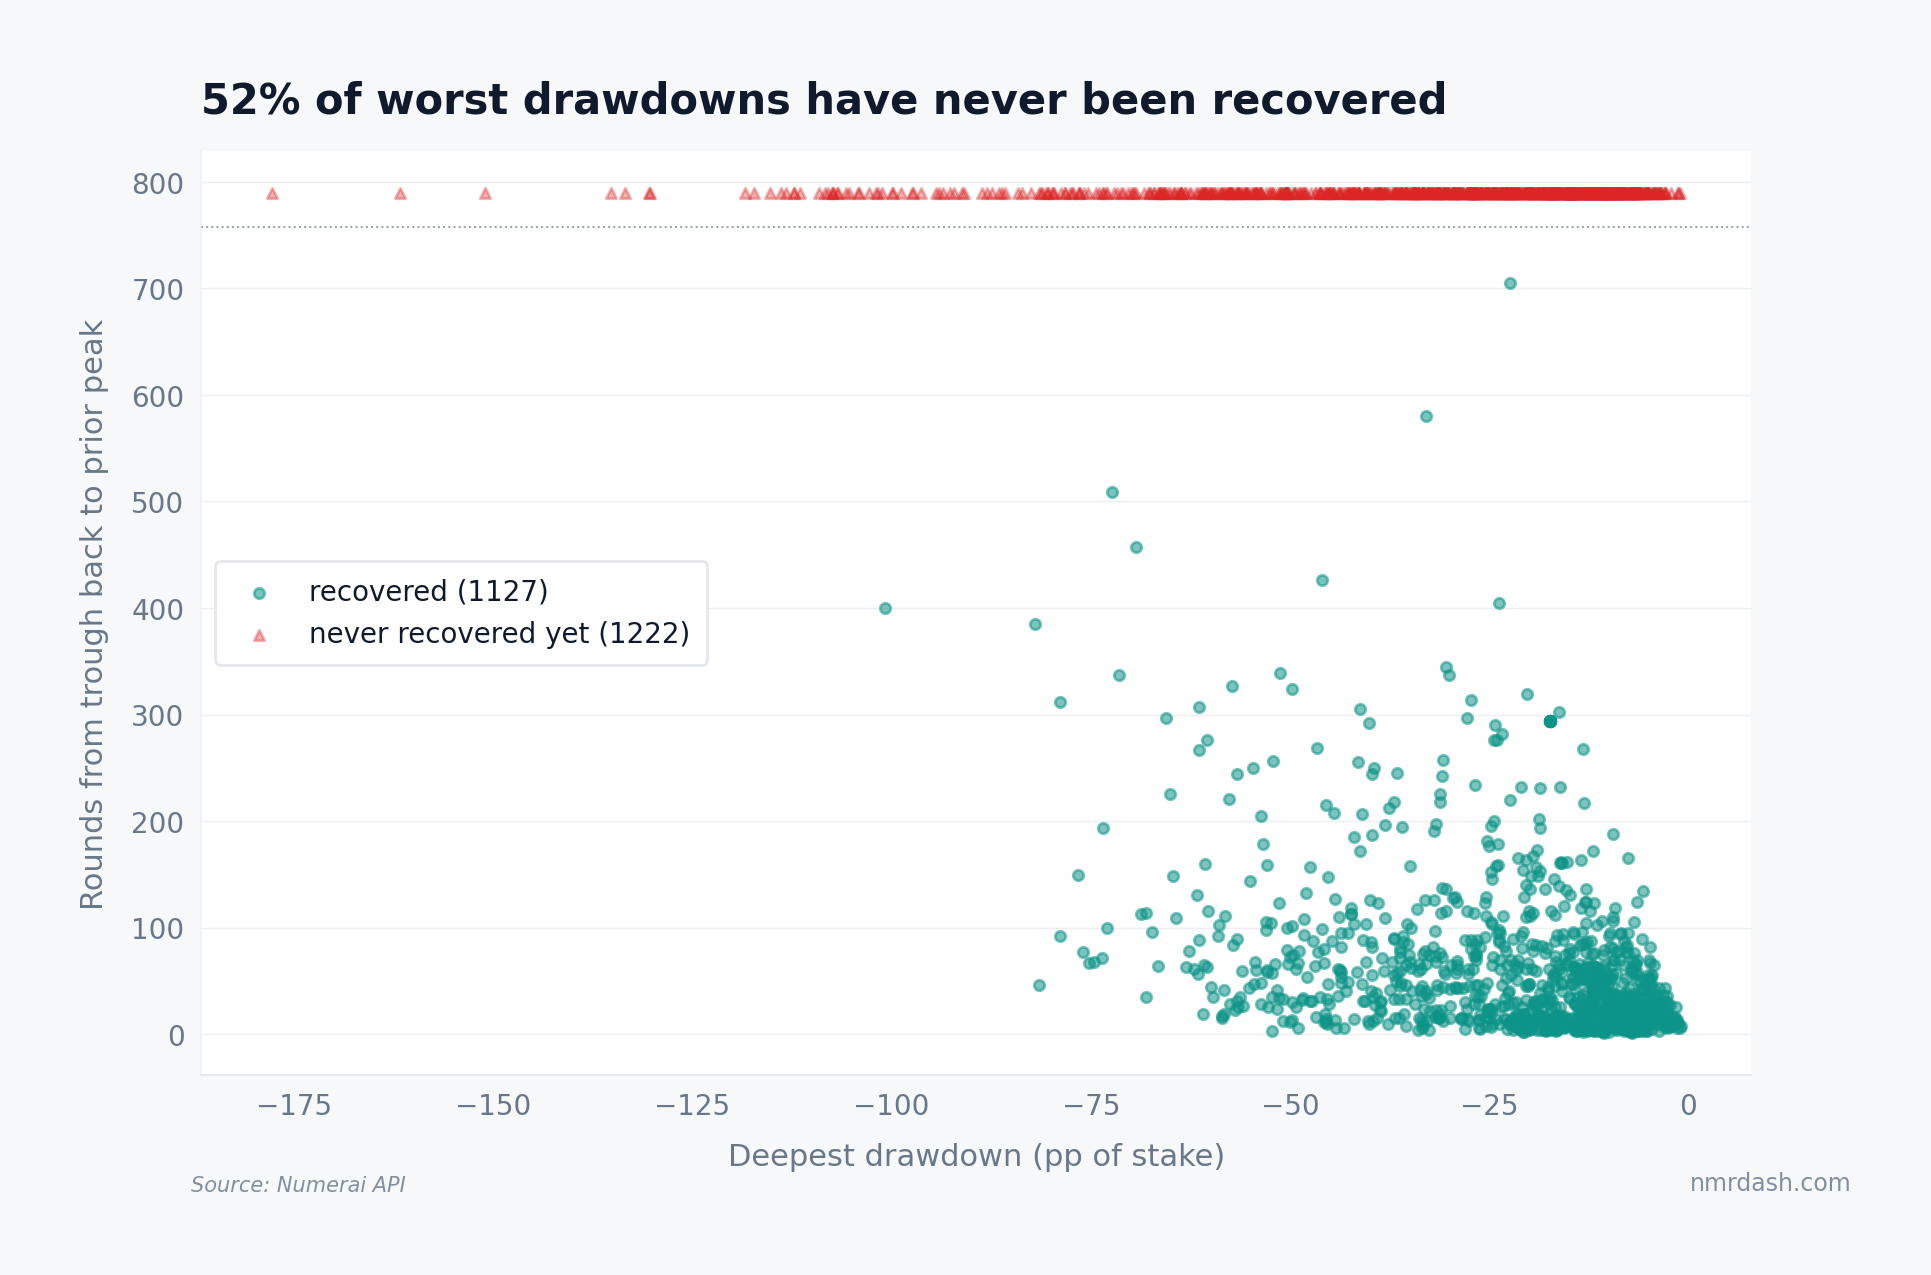
Depth is destiny here: recoveries from 20–40 points are routine, while beyond 80 points the recovered column is nearly empty. Two forces hide inside "never recovered," and I can't fully separate them. Some models genuinely decayed and kept bleeding. Others were abandoned mid-drawdown — the staking-behavior study found withdrawals during cold streaks are capitulation-sized, so part of this censoring is stakers pulling the plug at the bottom. Either way, the planning assumption "drawdowns mean-revert" is wrong half the time at career scale.
The 86% figure needs its own caveat: it is inflated by the current regime. With average MMC at record lows and half of staked model-rounds burning, 2025–26 has pushed almost every active curve off its peak simultaneously. Some of today's underwater majority will recover if the cycle turns; the 52% career rate is the structural floor, not the ceiling.
The best models drew down more than the middle
Splitting the panel by lifetime cumulative return produces the chart I found most useful, because it kills the intuition that drawdown depth identifies bad models.
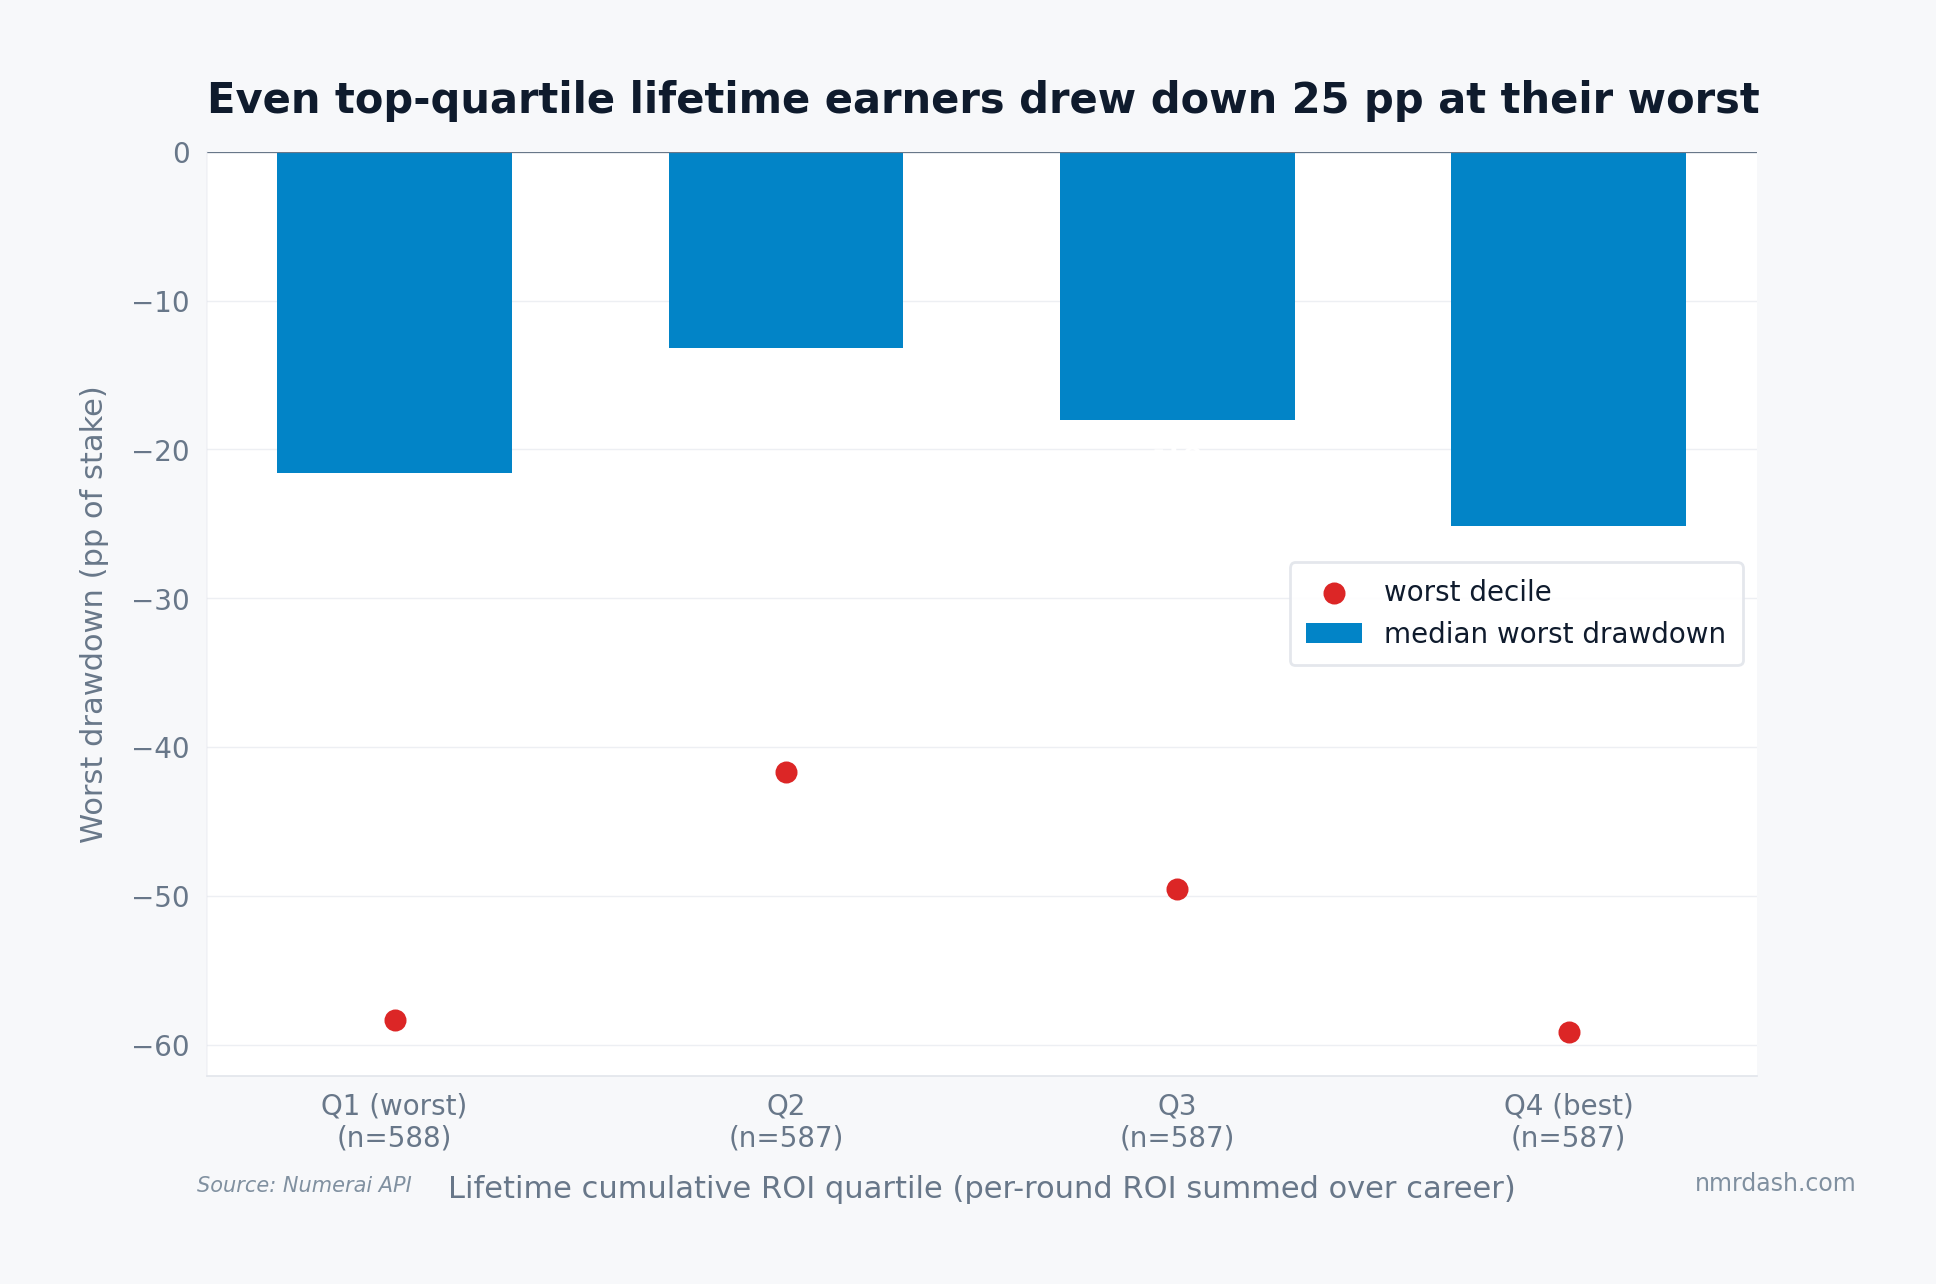
The top lifetime-ROI quartile (median +211 points cumulative) endured a median worst drawdown of 25 points, deeper than every other quartile, with a worst decile near −59. Part of this is exposure time, since the biggest lifetime earners have the longest careers and more chances to print a deep trough. But that is exactly the point: a long, profitable Numerai career and a 25-to-60-point drawdown are the same object viewed from different ends, the compounding-side lesson the volatility tax reached analytically. Drawdown depth alone told you almost nothing about which quartile a model would finish in; the middle quartiles, not the winners, had the shallowest troughs.
My sizing rule from these numbers: whatever NMR amount would force you to quit if 55% of it stopped being yours for a year, stake less than that. The median outcome is milder, but you don't get to experience the median — you get one path, and the burn streaks that generate these troughs arrive in clusters.
What would change this read
Two series would revise this. First, the recovery rate: if the share of drawdowns eventually repaid climbs well above half as the post-2025 cohorts mature, the "never repaid" coin flip softens and the sizing rule is too conservative. Second, the new staking system: per-round stake management under v3 atomic staking makes exiting mid-drawdown operationally easier, which I suspect will deepen the censoring problem rather than the drawdowns themselves: more curves frozen at the bottom by a one-click exit. I'll re-run this census when the migration settles.
Method notes: Classic (tournament 8), resolved rounds as of the 2026-07-20 ingest; per-round ROI is settled payout / selected stake for rounds staked at ≥10 NMR, well clear of the 2023–24 onboarding dust credits; benchmark rows excluded. Paths are additive sums of per-round ROI, i.e. a constant-stake approximation that ignores compounding, so "points of stake" understate NMR losses for models whose stakes grew. Panel requires ≥150 qualifying rounds (n=2,349, median 317 rounds per model). "Never recovered" is right-censored at each model's last staked round; deregistered models keep their final path. Recovery time is measured in rounds, mixing weekly and daily cadence.