Anatomy of a Numerai Burn Streak: The Worst Runs on Record
147 of 1,101 resolved Classic rounds burned more NMR than they paid. How deep Numerai burn streaks cut, how long they last, and how the pool recovered.
Numerai staking has a loss mechanic most yield products don't: when a model's predictions hurt the meta-model, part of its stake is burned. Round by round, the aggregate ledger is usually green, but not always. Of the 1,101 resolved Classic rounds with stake attached, 147 (13.4%) were net-burn rounds, where burned NMR exceeded earned NMR across all stakers combined. This post maps where those burns cluster, how much they cost, and how long the community sat underwater.
All figures below use total_earned and total_burned from the rounds table, tournament 8 only. Lifetime, resolved rounds have earned 2.49M NMR against 1.09M burned, a net of +1.40M NMR to stakers before NMR price effects.
Burns Come in Clusters
Plotting each round's net payout as a share of its stake shows burns are not sprinkled randomly.
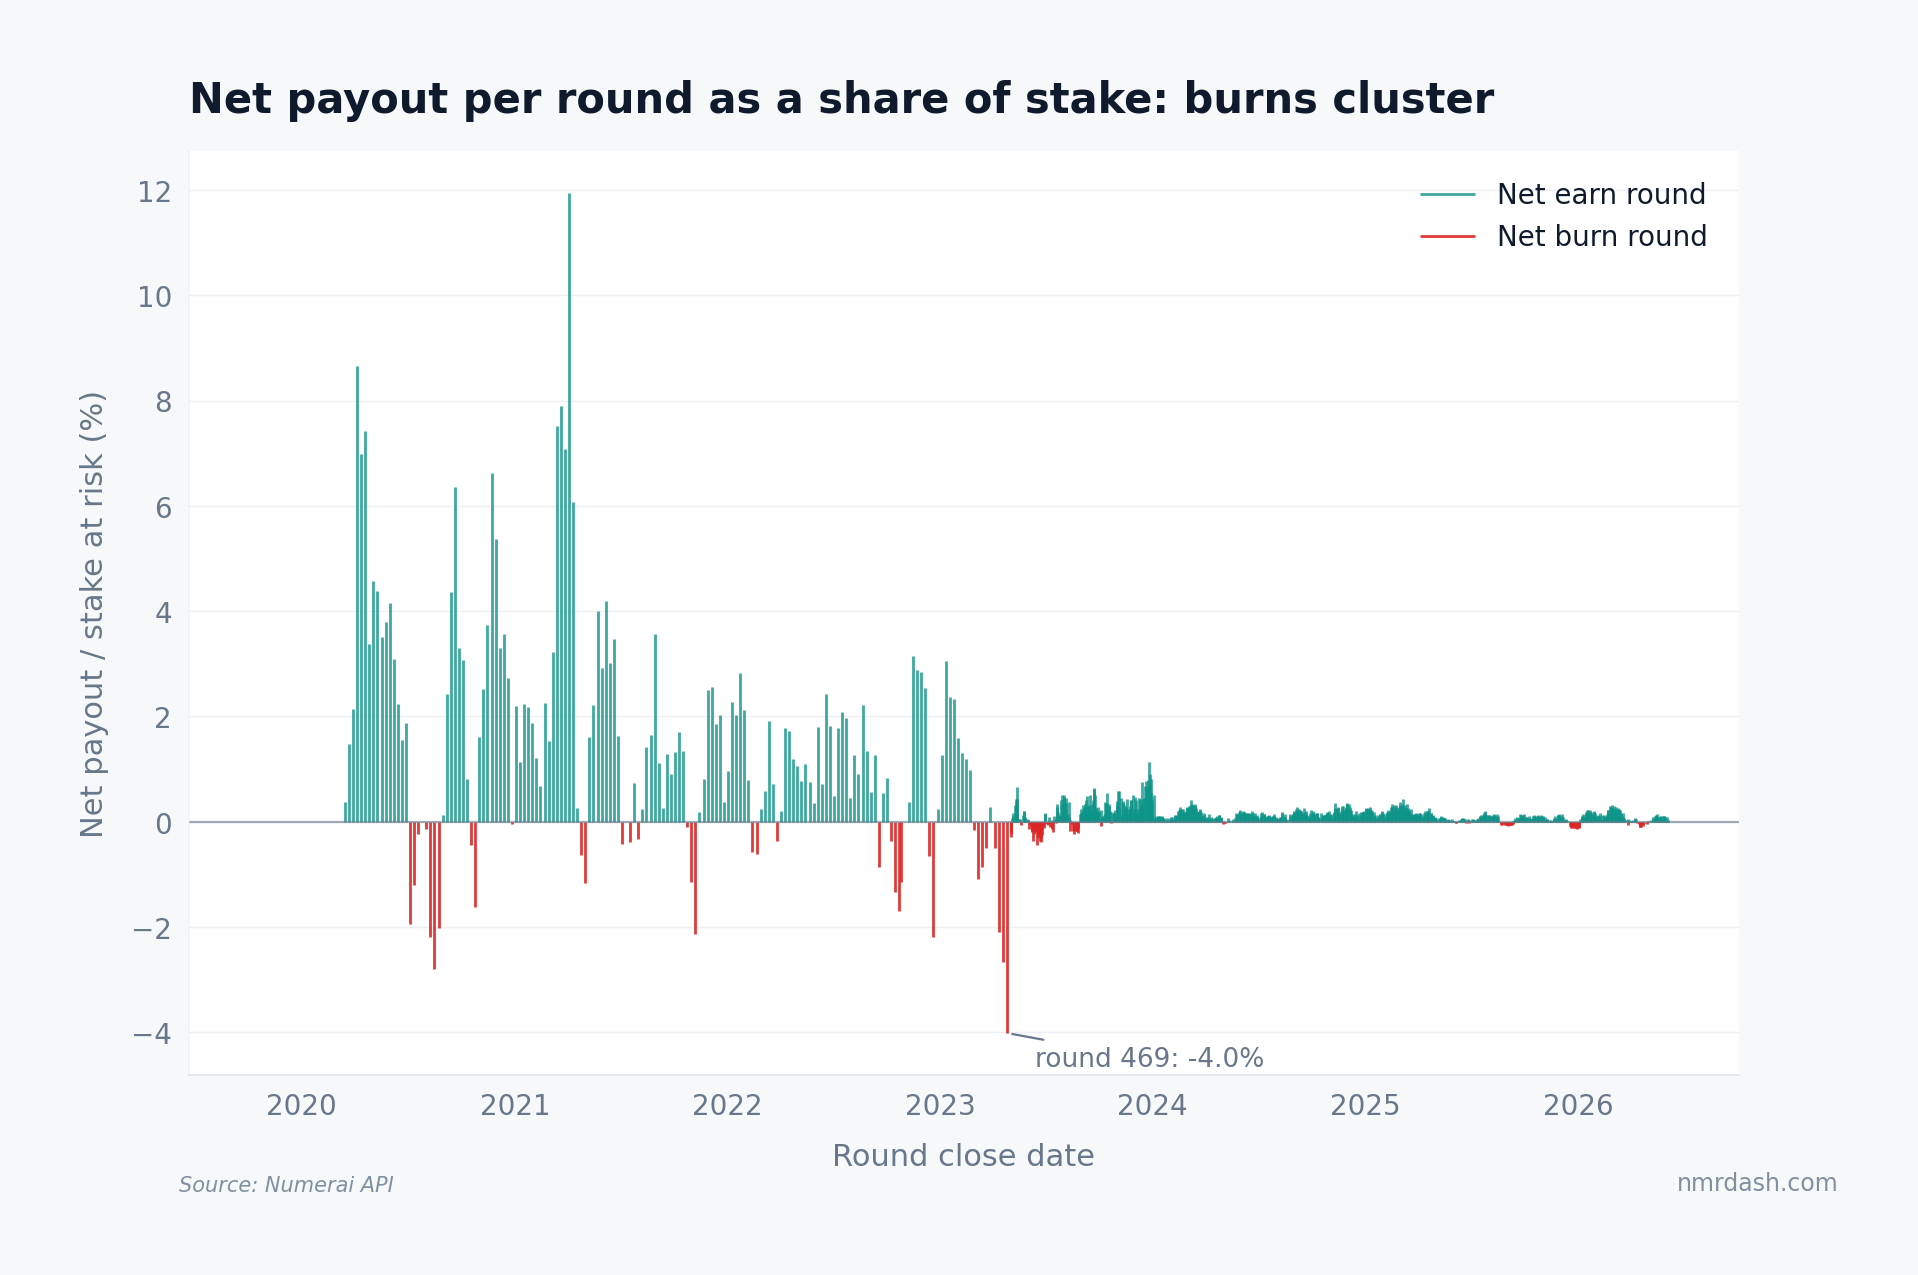
Burn rounds bunch into episodes: mid-2020, October 2021, the fourth quarter of 2022, and a long stretch through mid-2023. The single worst round on record is round 469, closed April 25, 2023, which burned a net 4.0% of everything at stake: 37,188 NMR gone in one settlement. Also visible: per-round magnitudes compress after 2023, when scoring moved fully to MMC-based payouts and typical net ratios shrank to well under 1%.
The Deepest Hole: 121K NMR Underwater
Streaks matter more than single rounds because stakers experience them as one continuous drawdown. The underwater curve — cumulative net payout measured against its own prior peak — shows every episode's true depth.
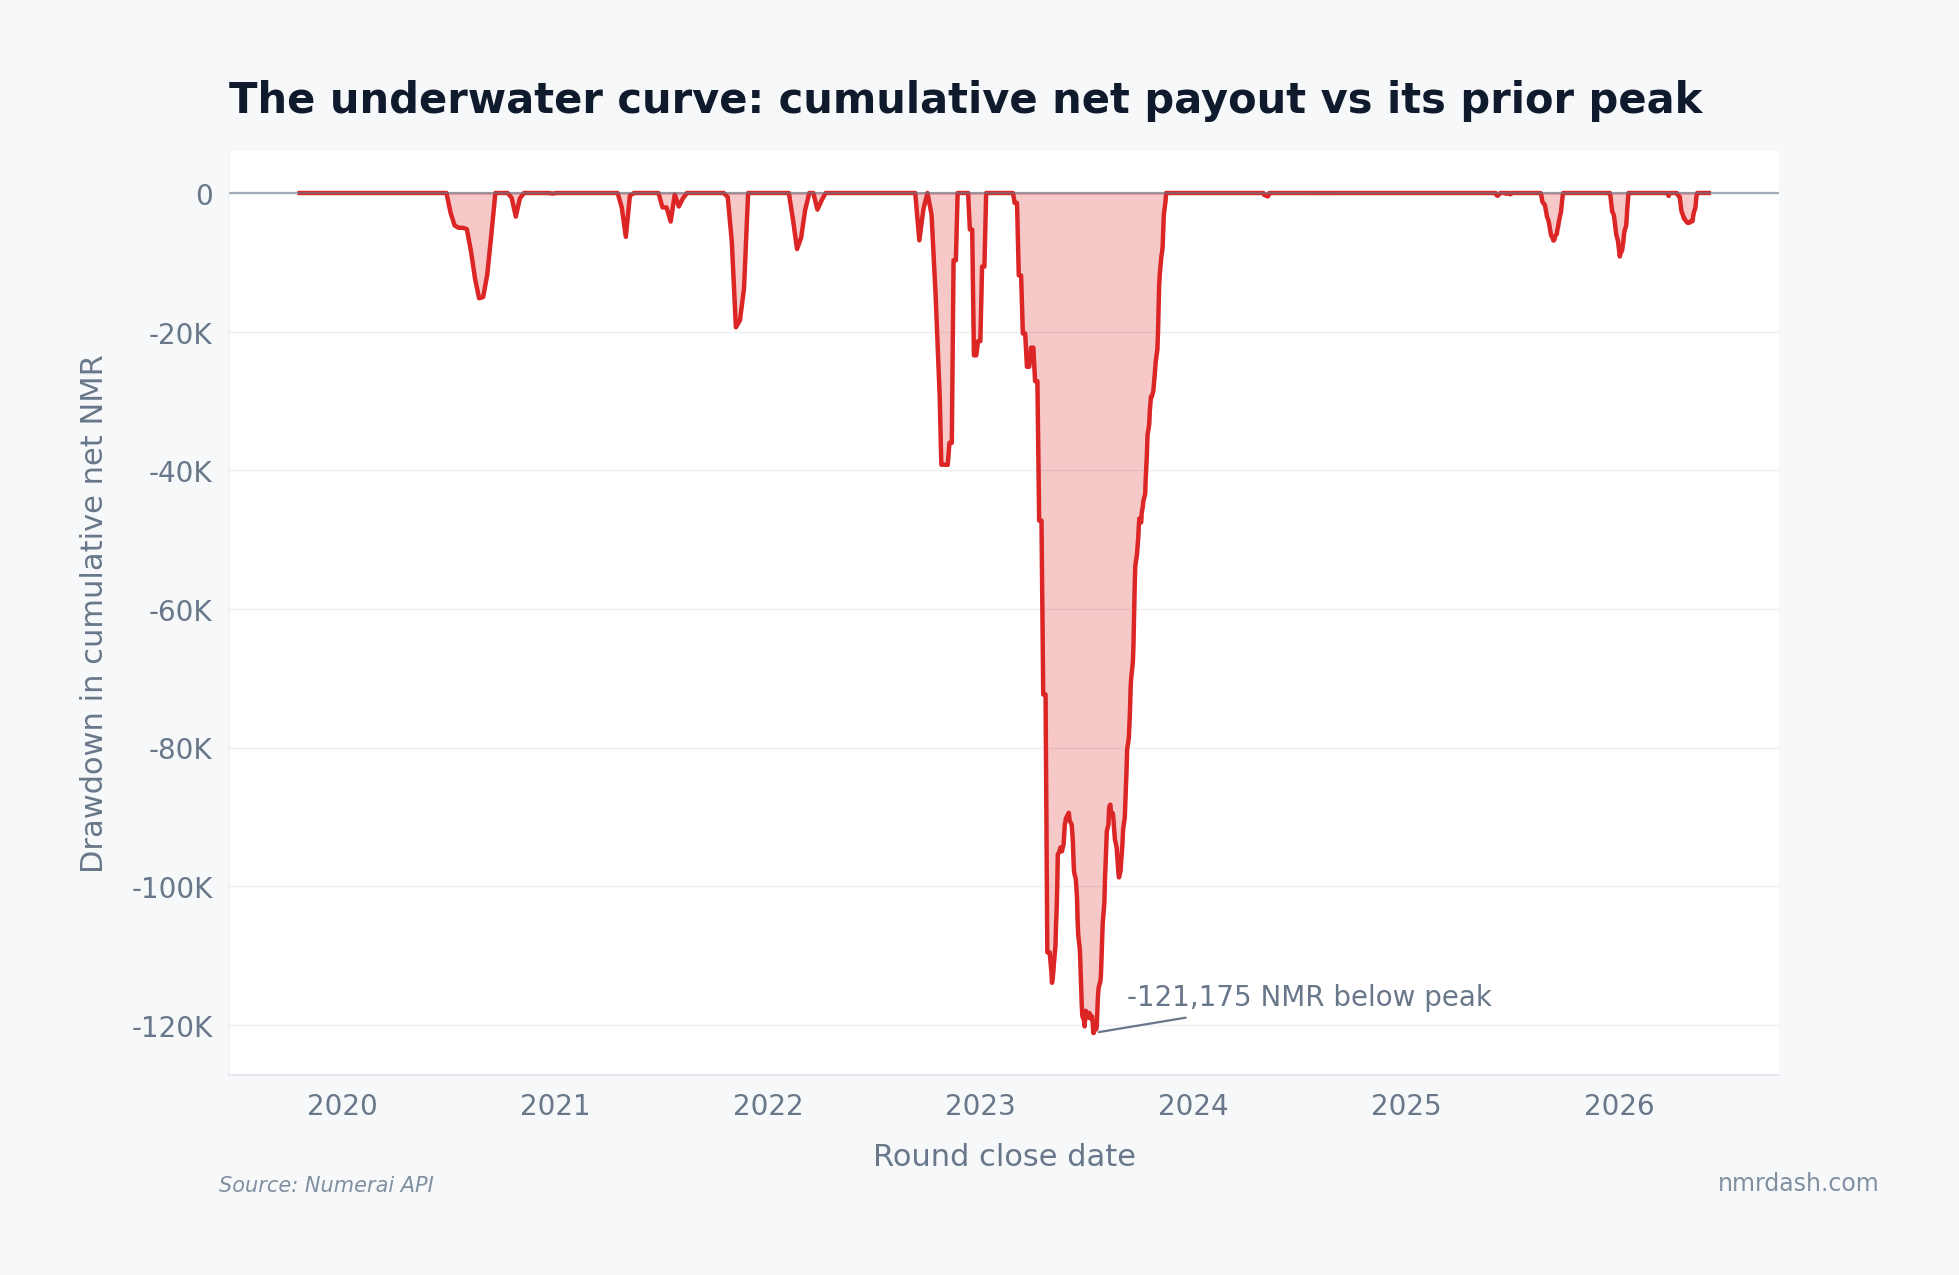
The 2023 episode dwarfs everything else. From the late-2022 peak, cumulative net payouts fell 121,175 NMR below high water, bottoming around round 526 in July 2023. The community then spent months climbing out: the longest underwater stretch in the dataset runs 186 consecutive rounds between new highs. By comparison, the worst pre-2022 drawdowns, in mid-2020 and late 2021, cut about 15K and 19K NMR deep.
The League Table of Bad Runs
Ranking consecutive net-burn runs by total NMR destroyed puts specific dates on the pain.
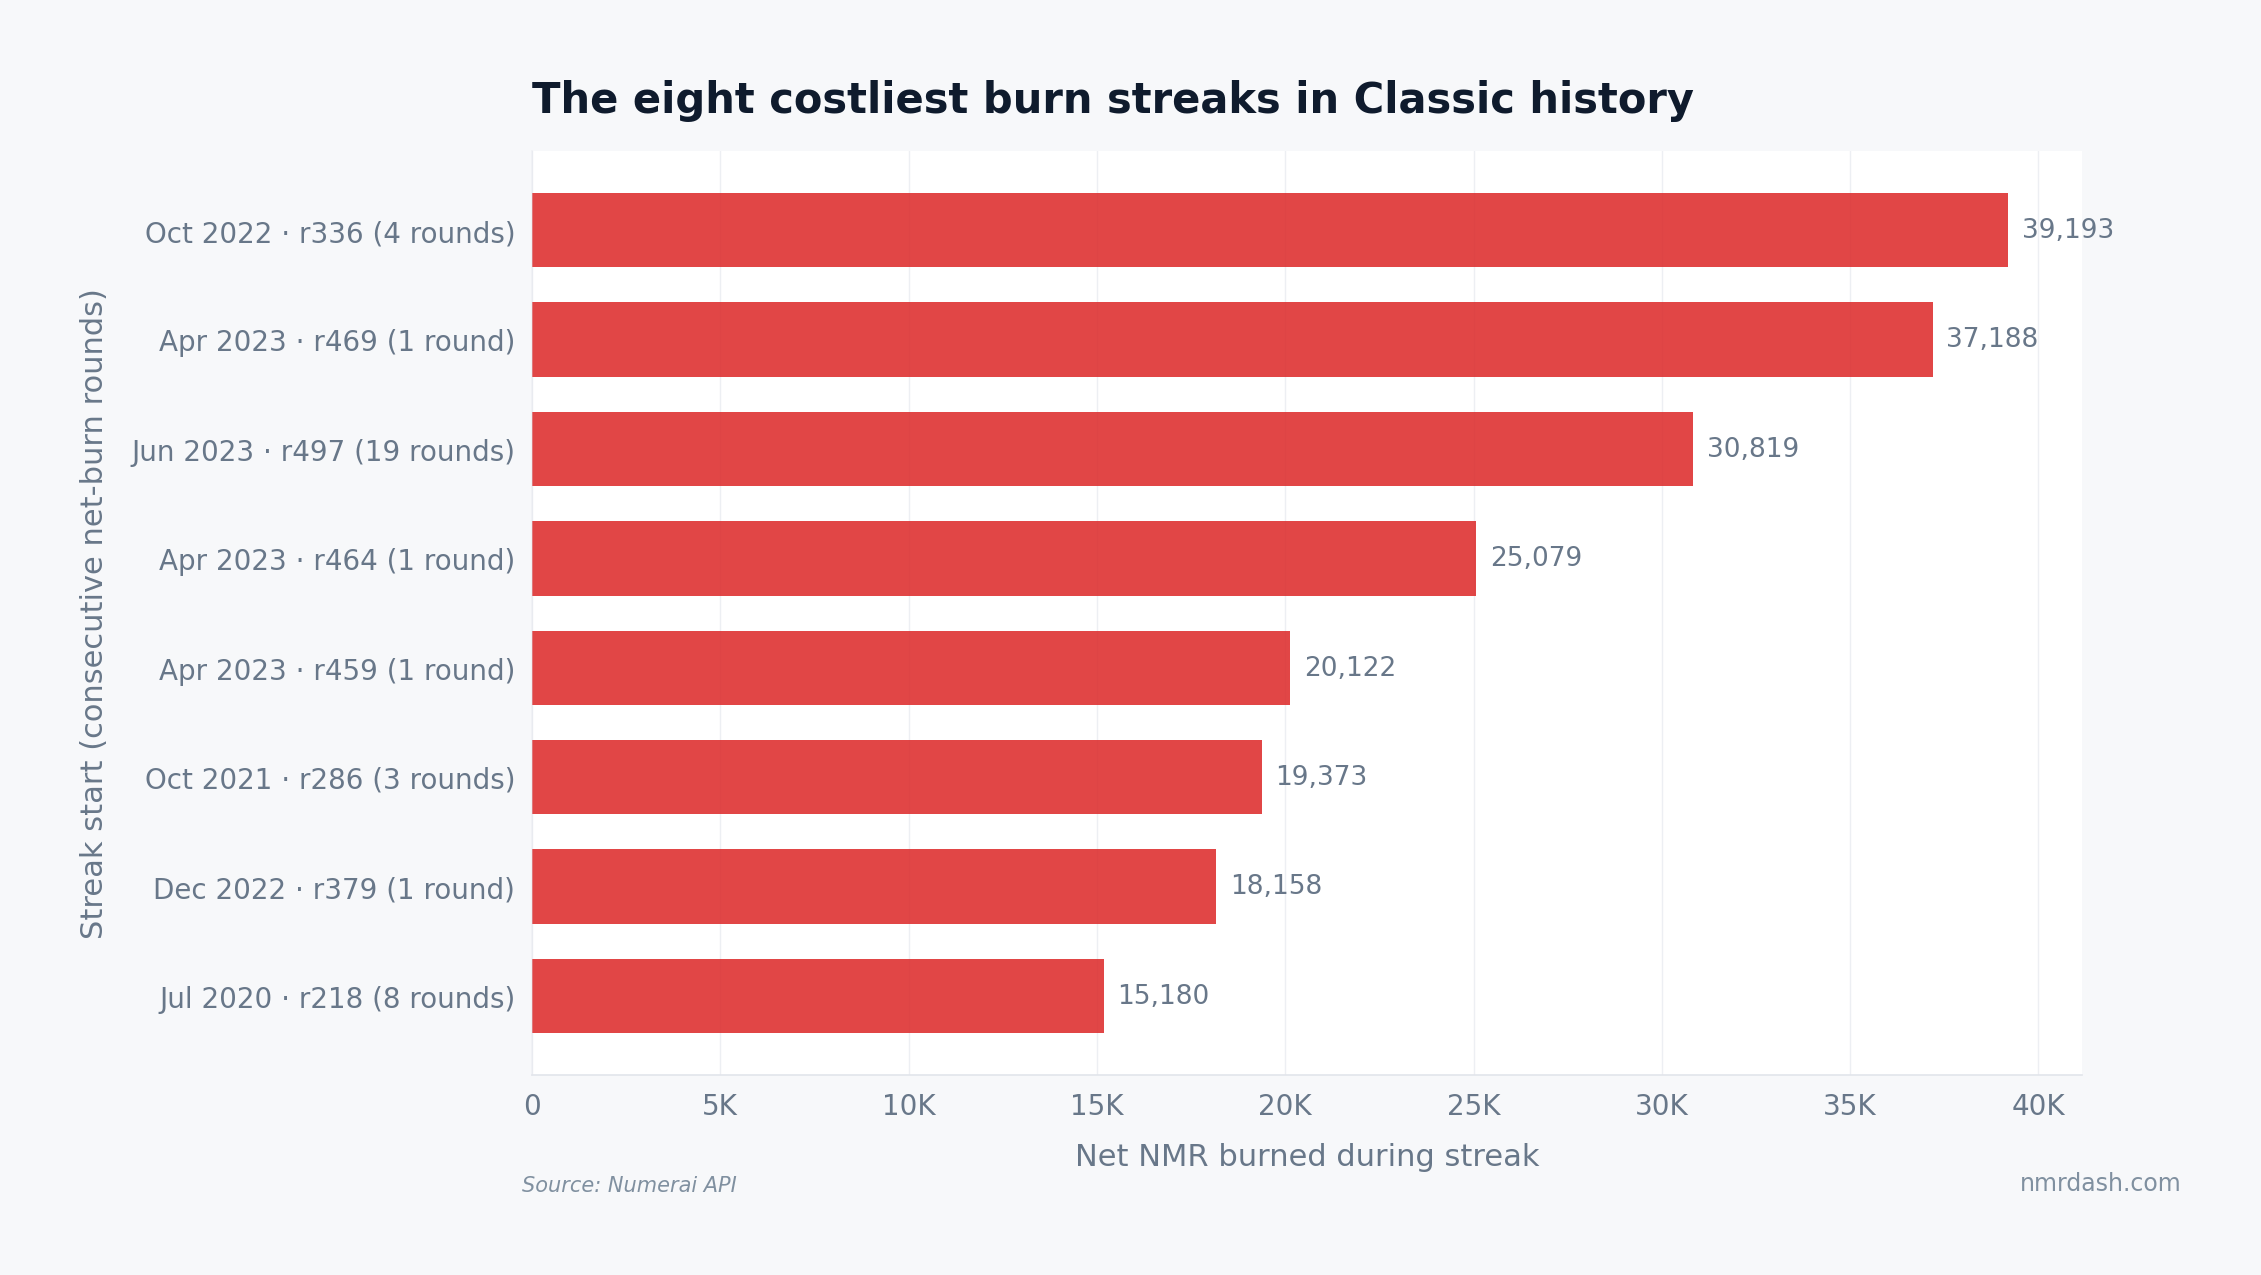
The costliest streak started in October 2022: four consecutive weekly rounds (from round 336) burning 39,193 NMR, the same weeks daily rounds launched. Second place is the single round 469 at 37,188 NMR. Third is the marathon: 19 consecutive net-burn rounds starting June 2023 (round 497) that burned 30,819 NMR in drips. April 2023 appears three times in the top eight (rounds 459, 464, 469 all standalone burns weeks apart), which is why that spring dominates the drawdown chart. The general market backdrop of these episodes is covered in Market Regimes and Numerai.
Most Streaks Die Young
The 147 burn rounds group into 49 streaks, and their length distribution is steeply front-loaded.
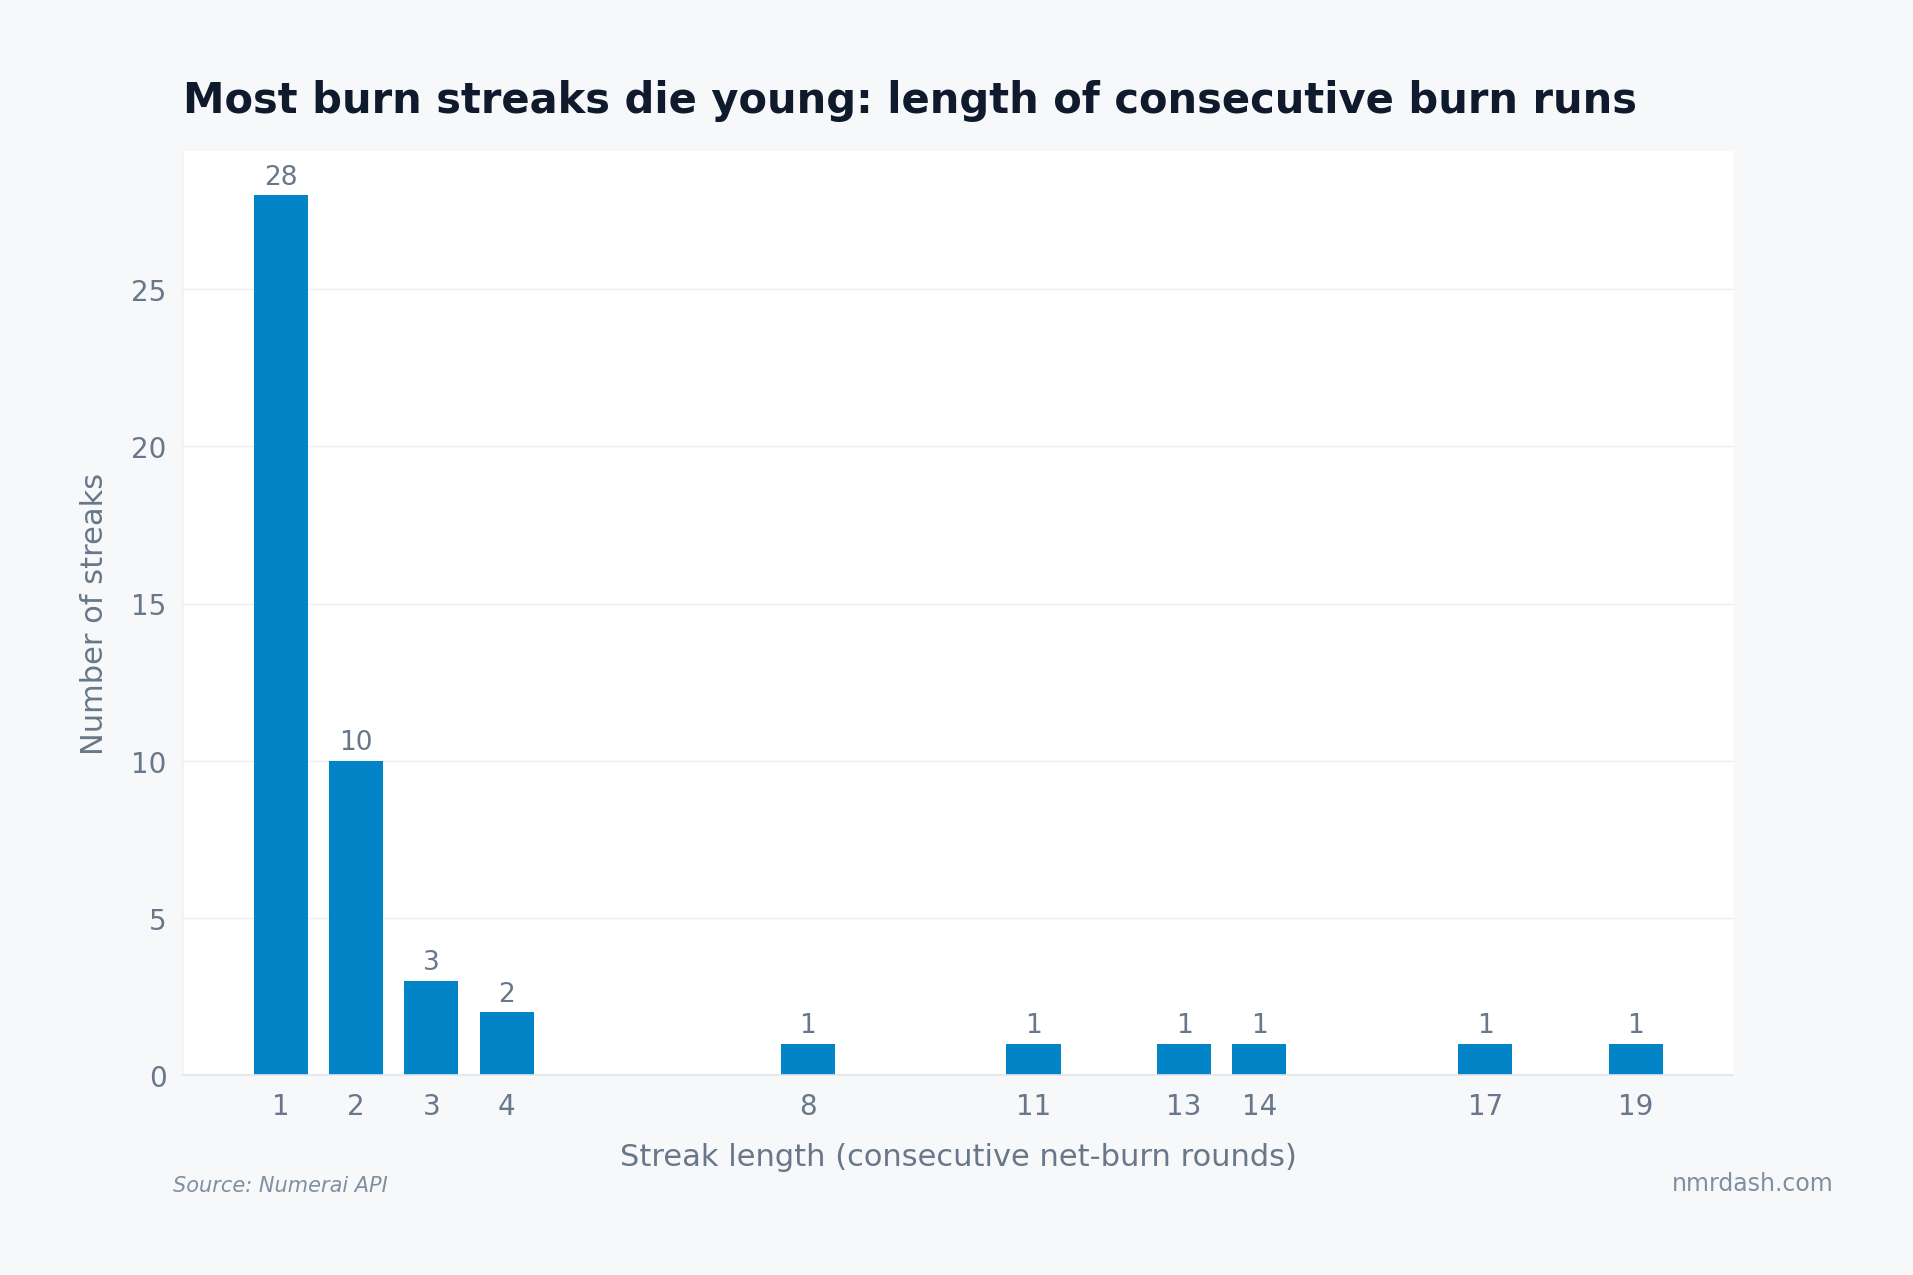
Twenty-eight of the 49 streaks lasted exactly one round, and ten more ended after two. Only six streaks ever ran five or more rounds, but those rare long runs carry an outsized share of the damage — the 19-round streak alone accounts for about 3% of all NMR ever burned. Statistically this is close to what independent rounds would produce, with one caveat: daily rounds overlap heavily in their scoring windows, so a single bad market month mechanically becomes a multi-round streak. That overlap is quantified in How Much NMR Is Locked.
Reading a Burn Season
Three durable observations from the record. First, scale beats frequency: 86.6% of rounds pay out net positive, and the total burn bill (1.09M NMR) is less than half of gross earnings — the system taxes bad months, it does not trend to zero. Second, the era matters: every top-eight streak except one falls between October 2021 and July 2023, under older scoring regimes and higher payout factors; the post-2023 regime produces shallower, shorter burns, as the timeline chart makes visible. Third, a staker's real risk horizon is the streak, not the round: sizing stake to survive a 121K-NMR-scale community drawdown (roughly 4-5% of the pool at the time, spread over months) is the practical lesson.
Whether stakers actually change behavior after these episodes is a separate question: Do Stakers Flee After Burns? tracks the pool's response, and Is Staking Profitable? puts the burns in full return context.