Is Numerai's Alpha Decaying? A Mid-2026 Deep Dive
Raw CORJ60 skill is cyclical, but the average Numerai model's MMC is at record lows and net yield has compressed from 179 bps per round to 8.7.
Half of all staked model-rounds in the Classic tournament now burn NMR. The average staked model's MMC is the most negative it has ever been. Net payout per round has fallen from 179 bps of stake in 2020 to 8.7 bps in 2026, a 95% compression. And yet the tournament has never been busier: roughly 13,000 models were scored per Classic round in July 2026, up from 8,000 a year earlier, and 874,365 NMR sits at stake across the three tournaments.
That contrast is the subject of this deep dive. "Is the alpha decaying?" is really three questions. Is the crowd predicting worse (skill)? Is the average model contributing less on top of the crowd (edge)? And does a unit of performance pay less than it used to (yield)? Using about 4.2 million staked model-round records from 2020 through mid-2026 (Classic only, and only rounds old enough for their 60-day metrics to have fully settled), the answers are: no, yes, and emphatically yes.
The tournament itself is fine
First the denominator. As of July 12, 2026 there are 874,365 NMR at stake (about $8.4M at $9.64 per NMR) across 6,635 staked models: 5,133 Classic, 877 Signals, 625 Crypto. Total stake is up 5.3% since the April statistical snapshot, and scored models per Classic round jumped 62% year over year, driven largely by the no-stake submission surge. Participation and collateral are growing. Whatever is decaying, it is not interest in the tournament.
Test 1: raw skill is cyclical, not decaying
CORJ60 measures what a model is ultimately for: correlation between its predictions and realized 60-day targets. If the crowd were losing its ability to forecast the market, the field's median CORJ60 should trend down. It doesn't — it cycles.
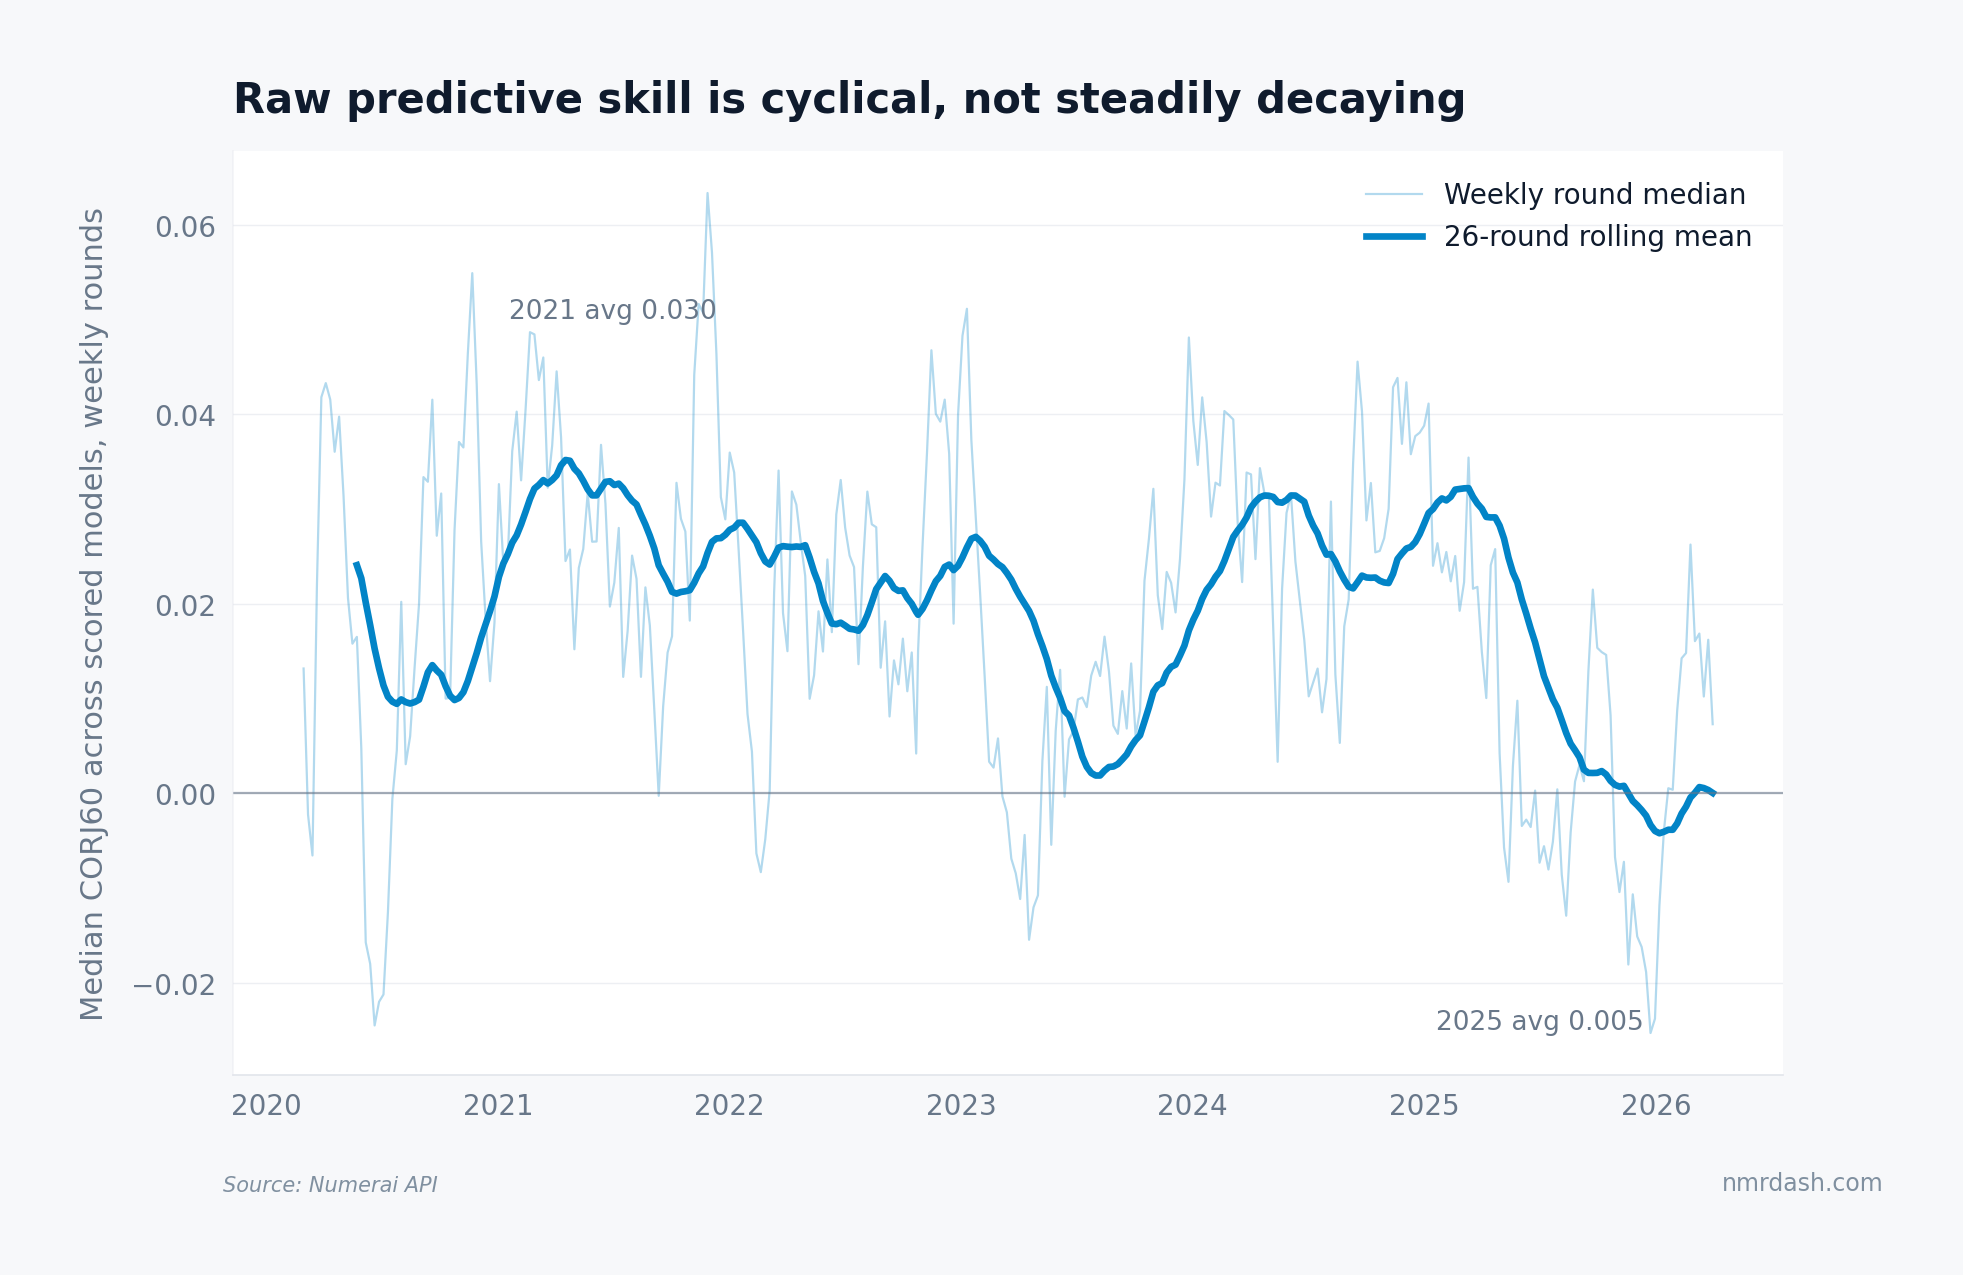
The yearly averages of the per-round median tell the story: 0.030 in 2021, down to 0.012 in 2023, back to 0.029 in 2024 (essentially a rerun of the 2021 peak), then 0.005 in 2025, the worst year on record. The 26-round rolling mean dipped below zero around the turn of 2026, its first sub-zero stretch ever, before recovering; fully-settled 2026 rounds average 0.009 and the spring readings were strong. This is regime, the same force the market regimes post documents. Verdict on skill decay: not proven. 2025 was brutal, but 2024 was one of the best years in tournament history.
Test 2: the average model's edge is genuinely decaying
MMC is different. It pays for what a model adds beyond the meta-model: originality, not accuracy (primer here). And by that yardstick the average participant is losing ground in a way that is not cyclical.
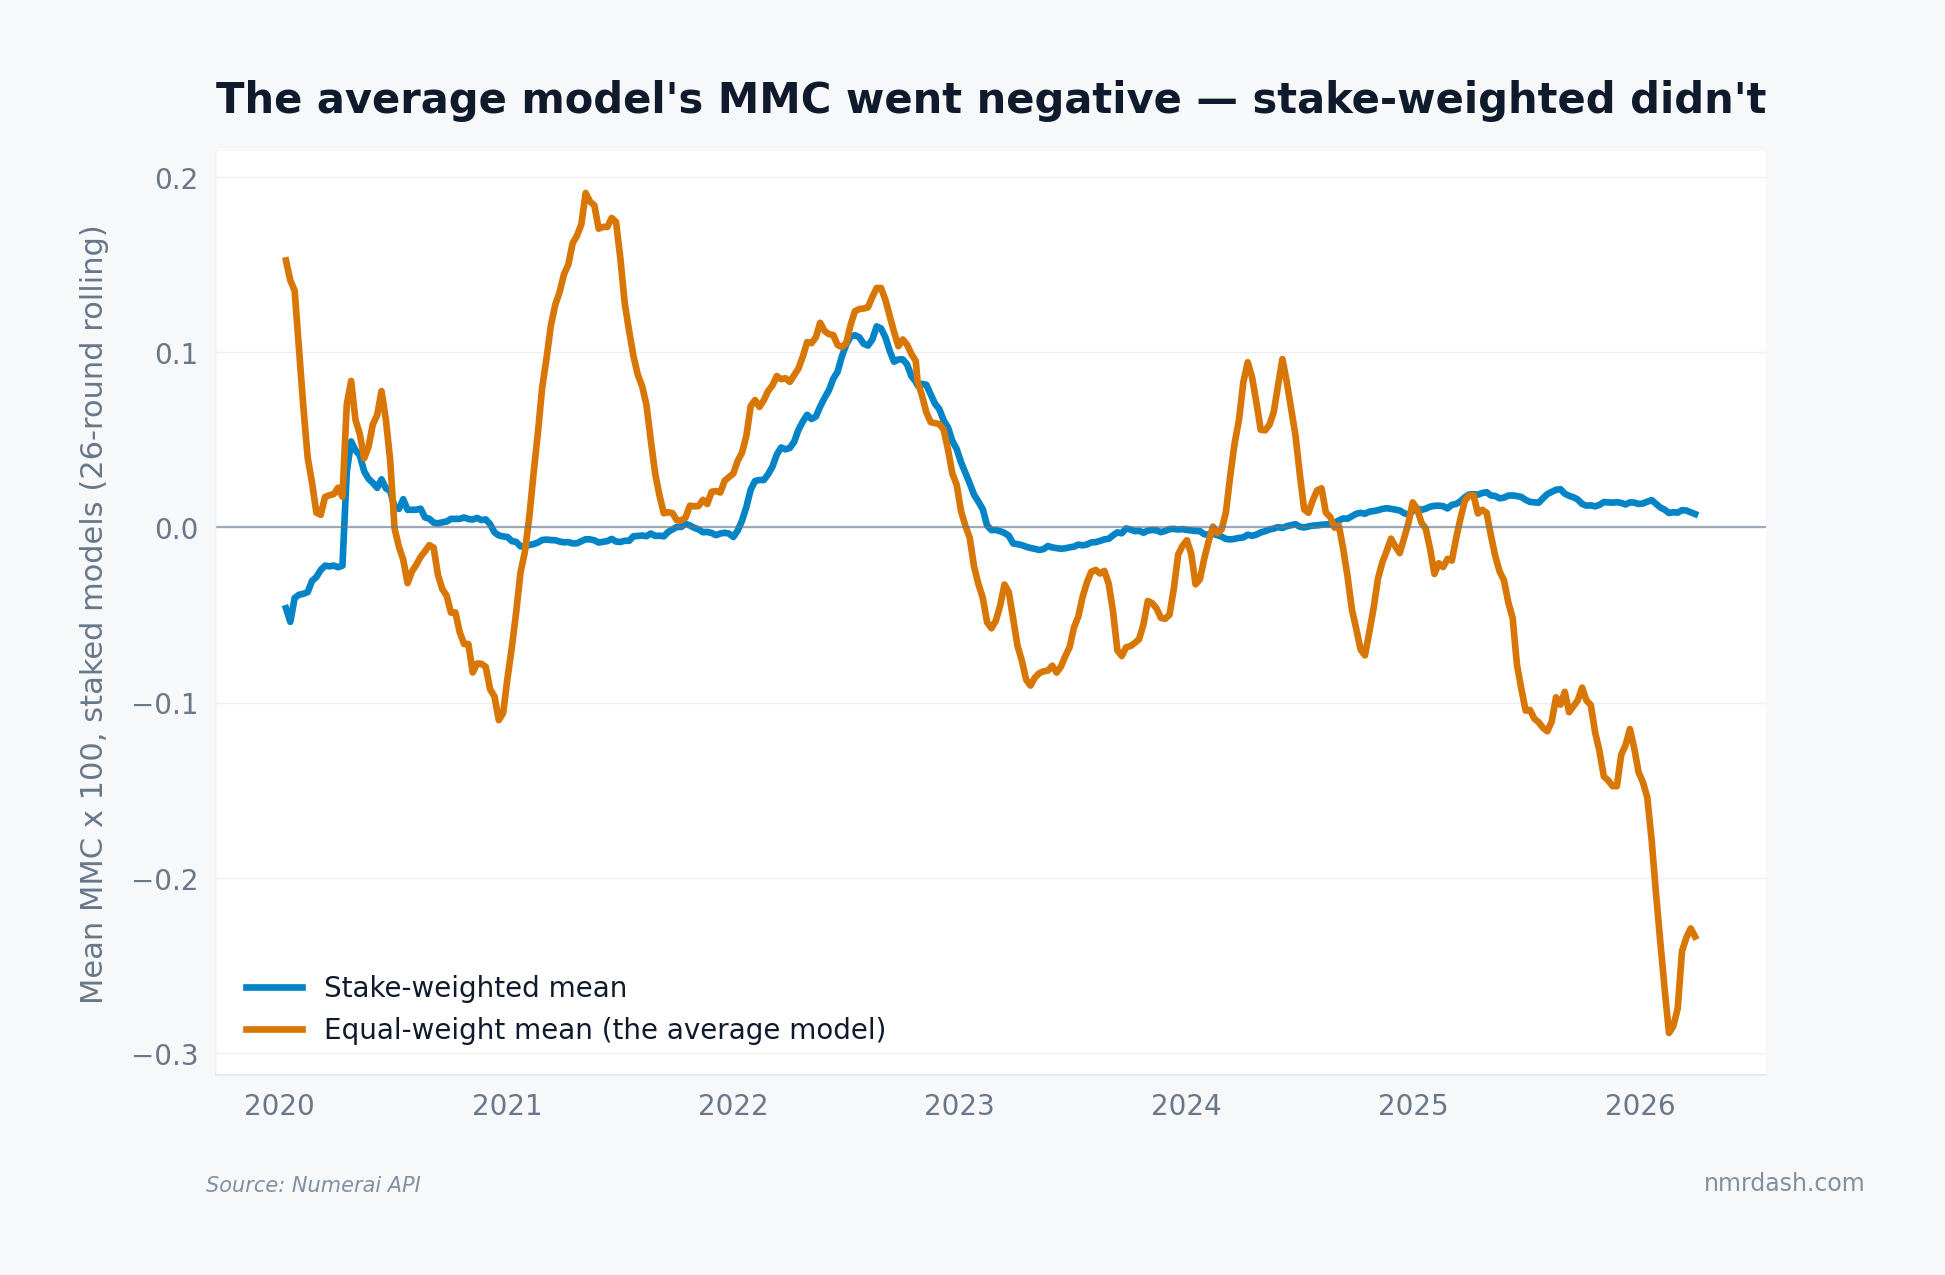
The field-wide median MMC (every scored model, benchmarks excluded) has been negative before, but never like this: −0.0022 in 2025 and −0.0034 in 2026, nearly seven times deeper than any earlier year. Among staked models specifically, the rolling equal-weight mean bottomed near −0.0029 in early 2026. The stake-weighted mean, by contrast, has held slightly above zero since mid-2025, the widest sustained gap between the two lines in tournament history. The same split shows up in raw accuracy: stake-weighted CORJ60 in 2026 is 0.020 versus 0.011 equal-weight. Capital has sorted itself onto the better half of the field, and the average model no longer improves the meta-model it competes against.
Composition doesn't explain it away. Stakes settled per round have drifted down, from about 5,200 in 2024 to 4,100 in 2026, so the equal-weight decline is not a flood of weak new stakers diluting the mean. It fits instead with two forces this blog has tracked separately: cross-model dispersion compressing roughly 40% since 2019 (metric convergence) and within-model aging, where even long-lived survivors decay as the meta-model absorbs their signal.
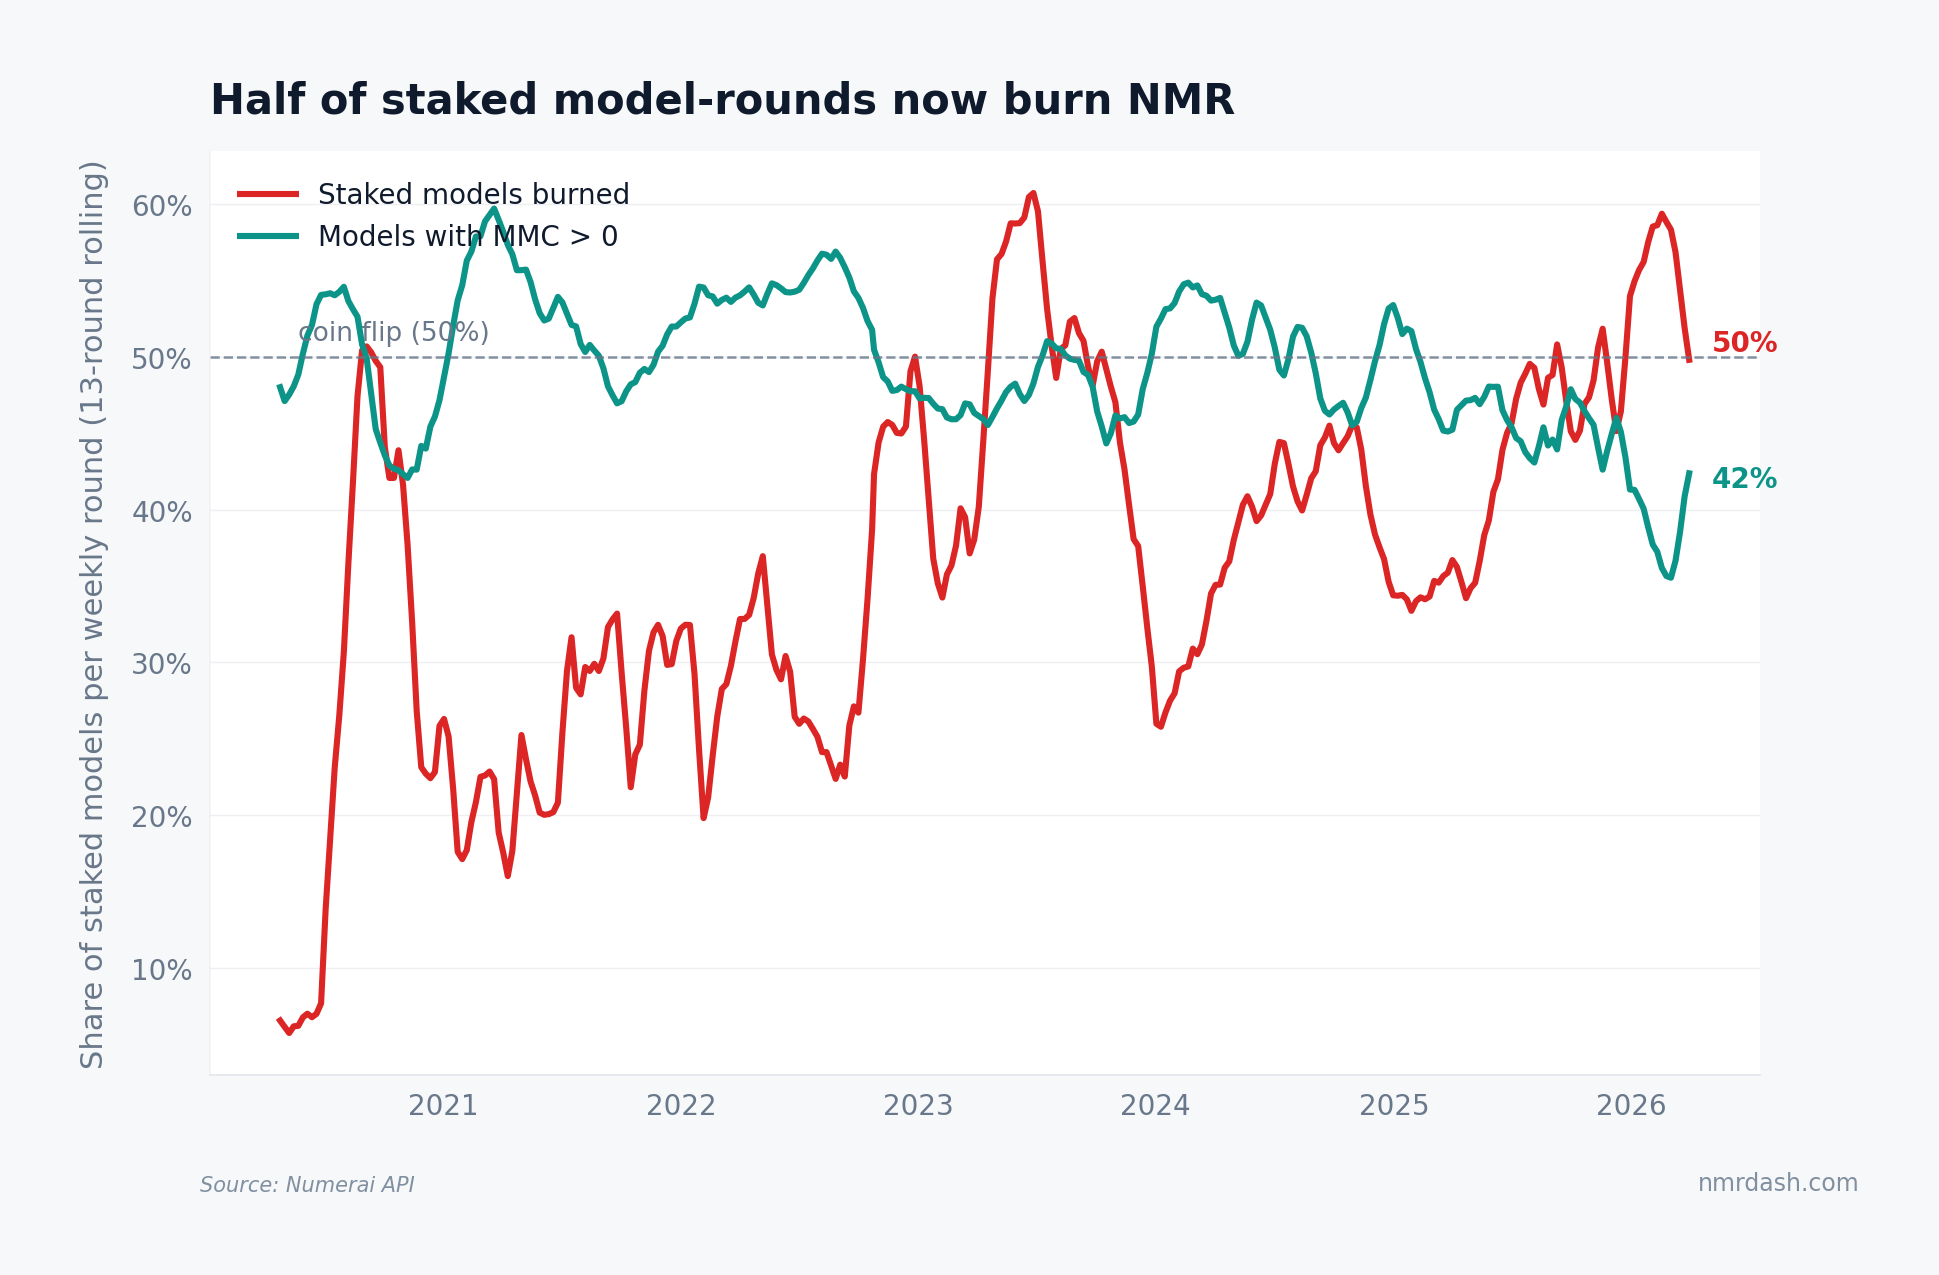
The consequences land in wallets. In 2020–2022, 26–29% of staked model-rounds burned. The share spiked briefly to 60% in the brutal mid-2023 stretch, averaged 46% across 2025, and sits at 50% in 2026 after peaking near 59% early in the year. Meanwhile the share of staked models posting positive MMC fell from 52% in 2021 to 42% now. Staking an average model has become a coin flip that pays tails.
Test 3: the price of alpha, compressed 95%
Even where edge survives, it converts to far less NMR than it used to.
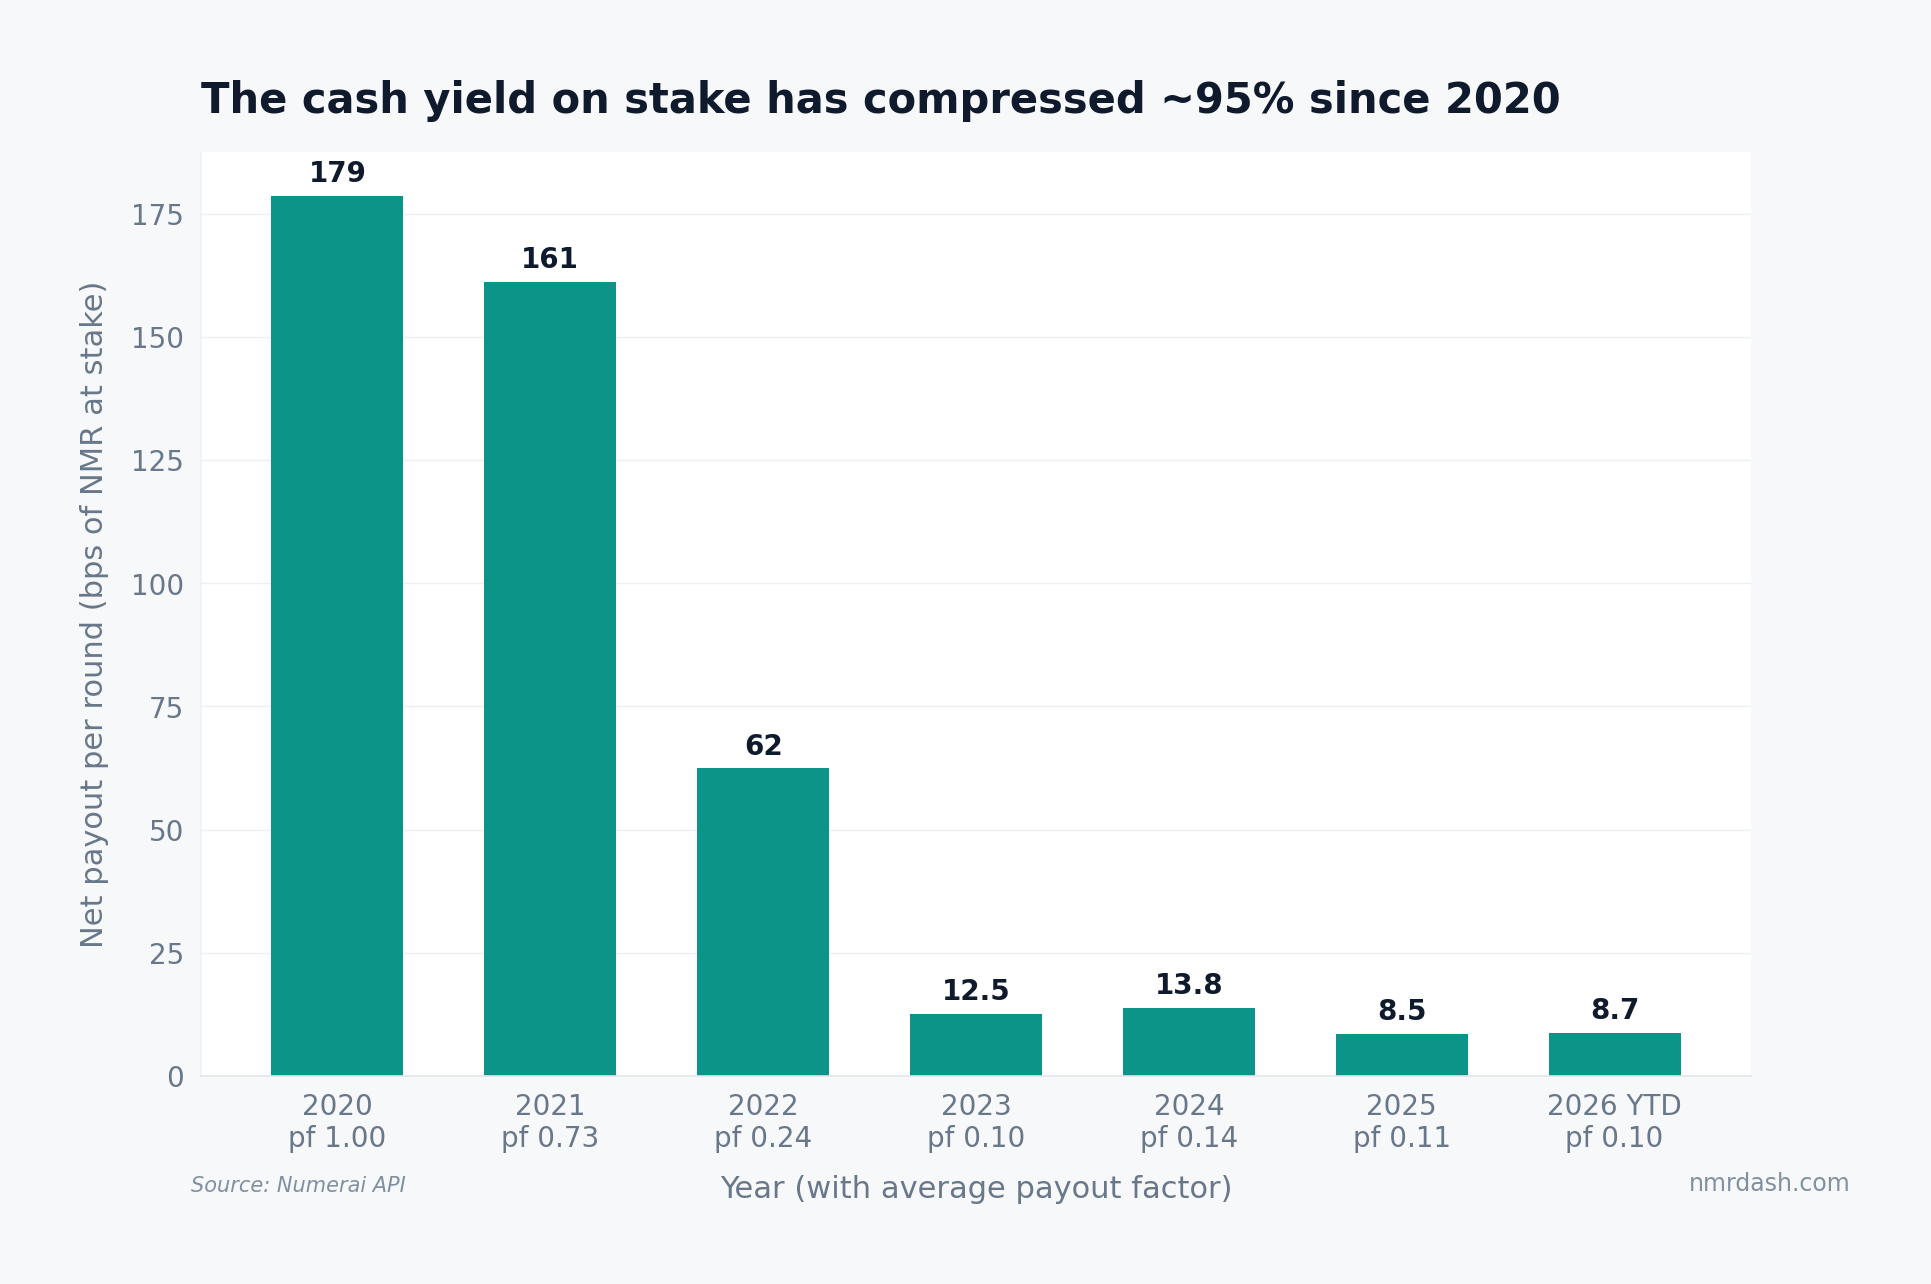
Net payout per round (earned minus burned, as a share of everything at stake) has fallen from 179 bps in 2020 to 8.7 bps in 2026. Most of that is mechanical: the payout factor slid from 1.00 to about 0.10 as the staked pool grew from an average of 115K NMR at risk per round to 693K. The same score earns a tenth of what it did five years ago, and the margin for error is gone: December 2025 and April 2026 both printed negative net payouts for the whole field.
The Verdict
Alpha decay on Numerai is real, but it lives in specific places. The crowd's raw predictive skill is not eroding; it cycles with the market, and 2024 matched the best years on record. What is decaying is the average participant's edge over the meta-model, steadily and measurably, and the price Numerai pays per unit of performance, drastically. The tournament is behaving like a maturing market: more participants, tighter spreads, and returns that accrue to genuinely differentiated signal rather than to showing up.
For stakers the practical readings are blunt. Being average is now net-negative: the median model subtracts from the meta-model and burns half the time. The stake-weighted crowd shows where the durable edge sits, and it is not evenly distributed. And with the payout factor near 0.10, yield expectations set in the 2020–2021 era are off by an order of magnitude. The live version of every series here is on the Trends and Tokenomics pages, refreshed daily.