Numerai Submission Consistency: What Skipping Rounds Costs
Of 12,300 staked Numerai Classic models, 26% never miss a round — and the most consistent attendance bucket earns the highest payout per staked NMR.
A staked Numerai model only gets scored in rounds where a submission actually landed. Miss the window — a broken cron job, an expired API key, a vacation — and the stake sits idle while everyone else competes. How often does that happen, and does it cost anything? Using every Classic staked model since round 500 with at least 50 rounds between its first and last staked appearance (12,300 models), the answer: attendance is remarkably high, most lapses are brief, and the most consistent models also earn the most per staked NMR.
Participation here means a model has a scored, staked performance row for a round between its first and last staked round. That span-based definition deliberately ignores what happens before a model's debut and after its retirement — for the retirement story, see Model Survival.
A Quarter of Models Never Miss
The distribution of participation rates is dominated by its right edge.
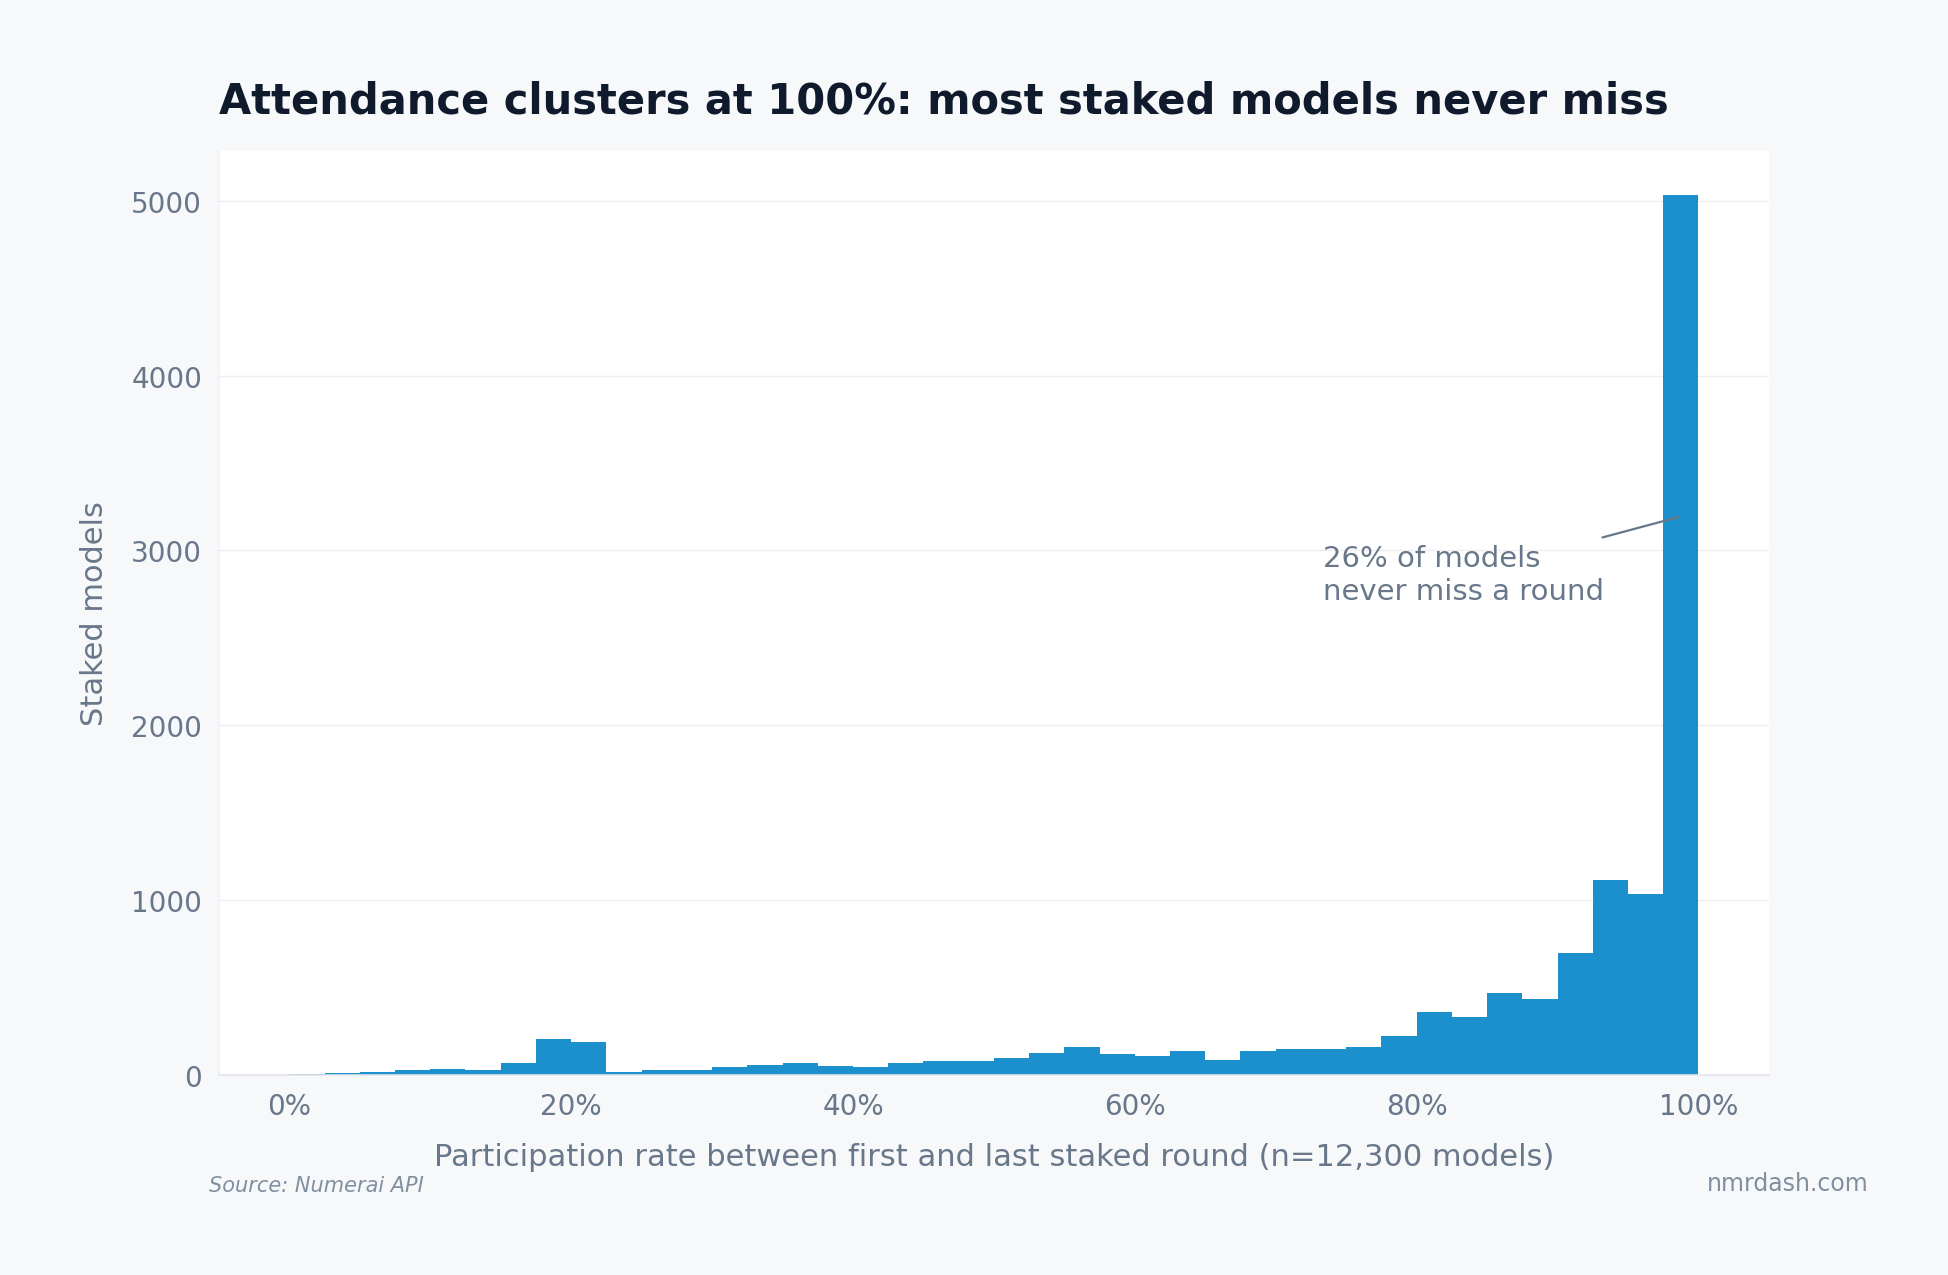
26% of staked models have a perfect record: every single round between their first and last staked appearance, scored. Half sit at 95% or better, and the median is 94.8%. The left tail exists (9.5% of models participate in fewer than half the rounds mid-span) but it is thin. Given that daily rounds leave a one-day submission window, this reliability is an infrastructure statement: the fleet is overwhelmingly automated, consistent with the pattern in The No-Stake Submission Surge.
Attendance Pays
Does consistency correlate with results? Pooling payouts and stake within each participation bucket:
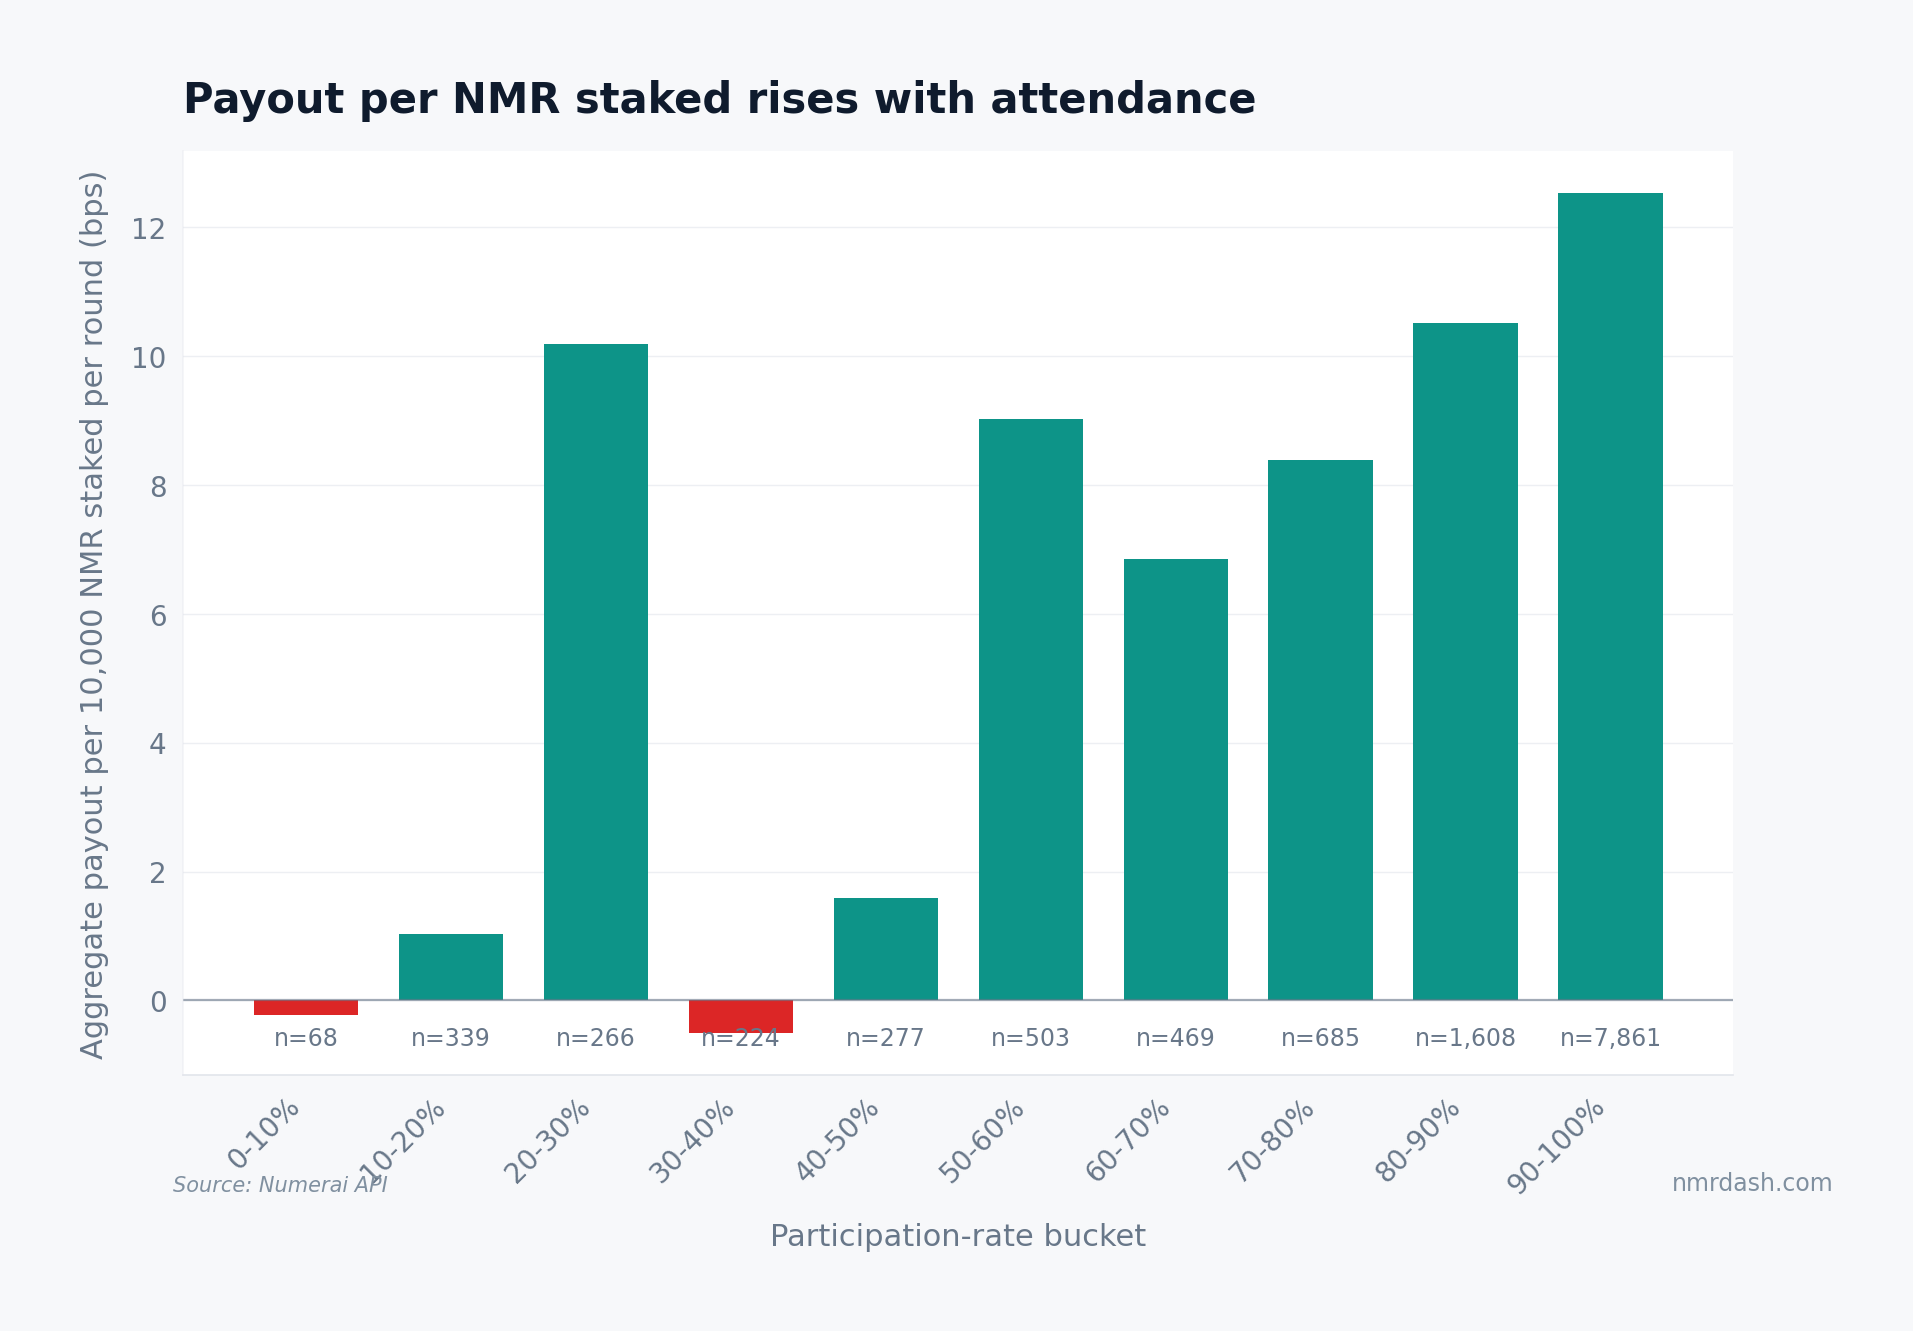
Models in the 90-100% attendance bucket earned about 12.5 bps per round per 10,000 NMR staked, the best of any bucket, and the 80-90% group follows at 10.5 bps. The bottom bucket (under 10% attendance) lost money outright, and the small 30-40% bucket also dipped below zero. The middle of the chart is noisy because the buckets are small (a few hundred models each, against 7,861 in the top bucket), so read the pattern from the edges rather than any single bar.
Two forces plausibly drive the association, and the data cannot fully separate them. Skipping has a mechanical cost: an absent round earns nothing, while the stake stays exposed to opportunity cost. But selection surely contributes too — operators who keep pipelines running without gaps are the same operators who monitor, retrain, and take the tournament seriously. Either way, the operational habit and the payout go together.
Lapses Are Stumbles, Not Sabbaticals
When models do miss, how long do the outages last?
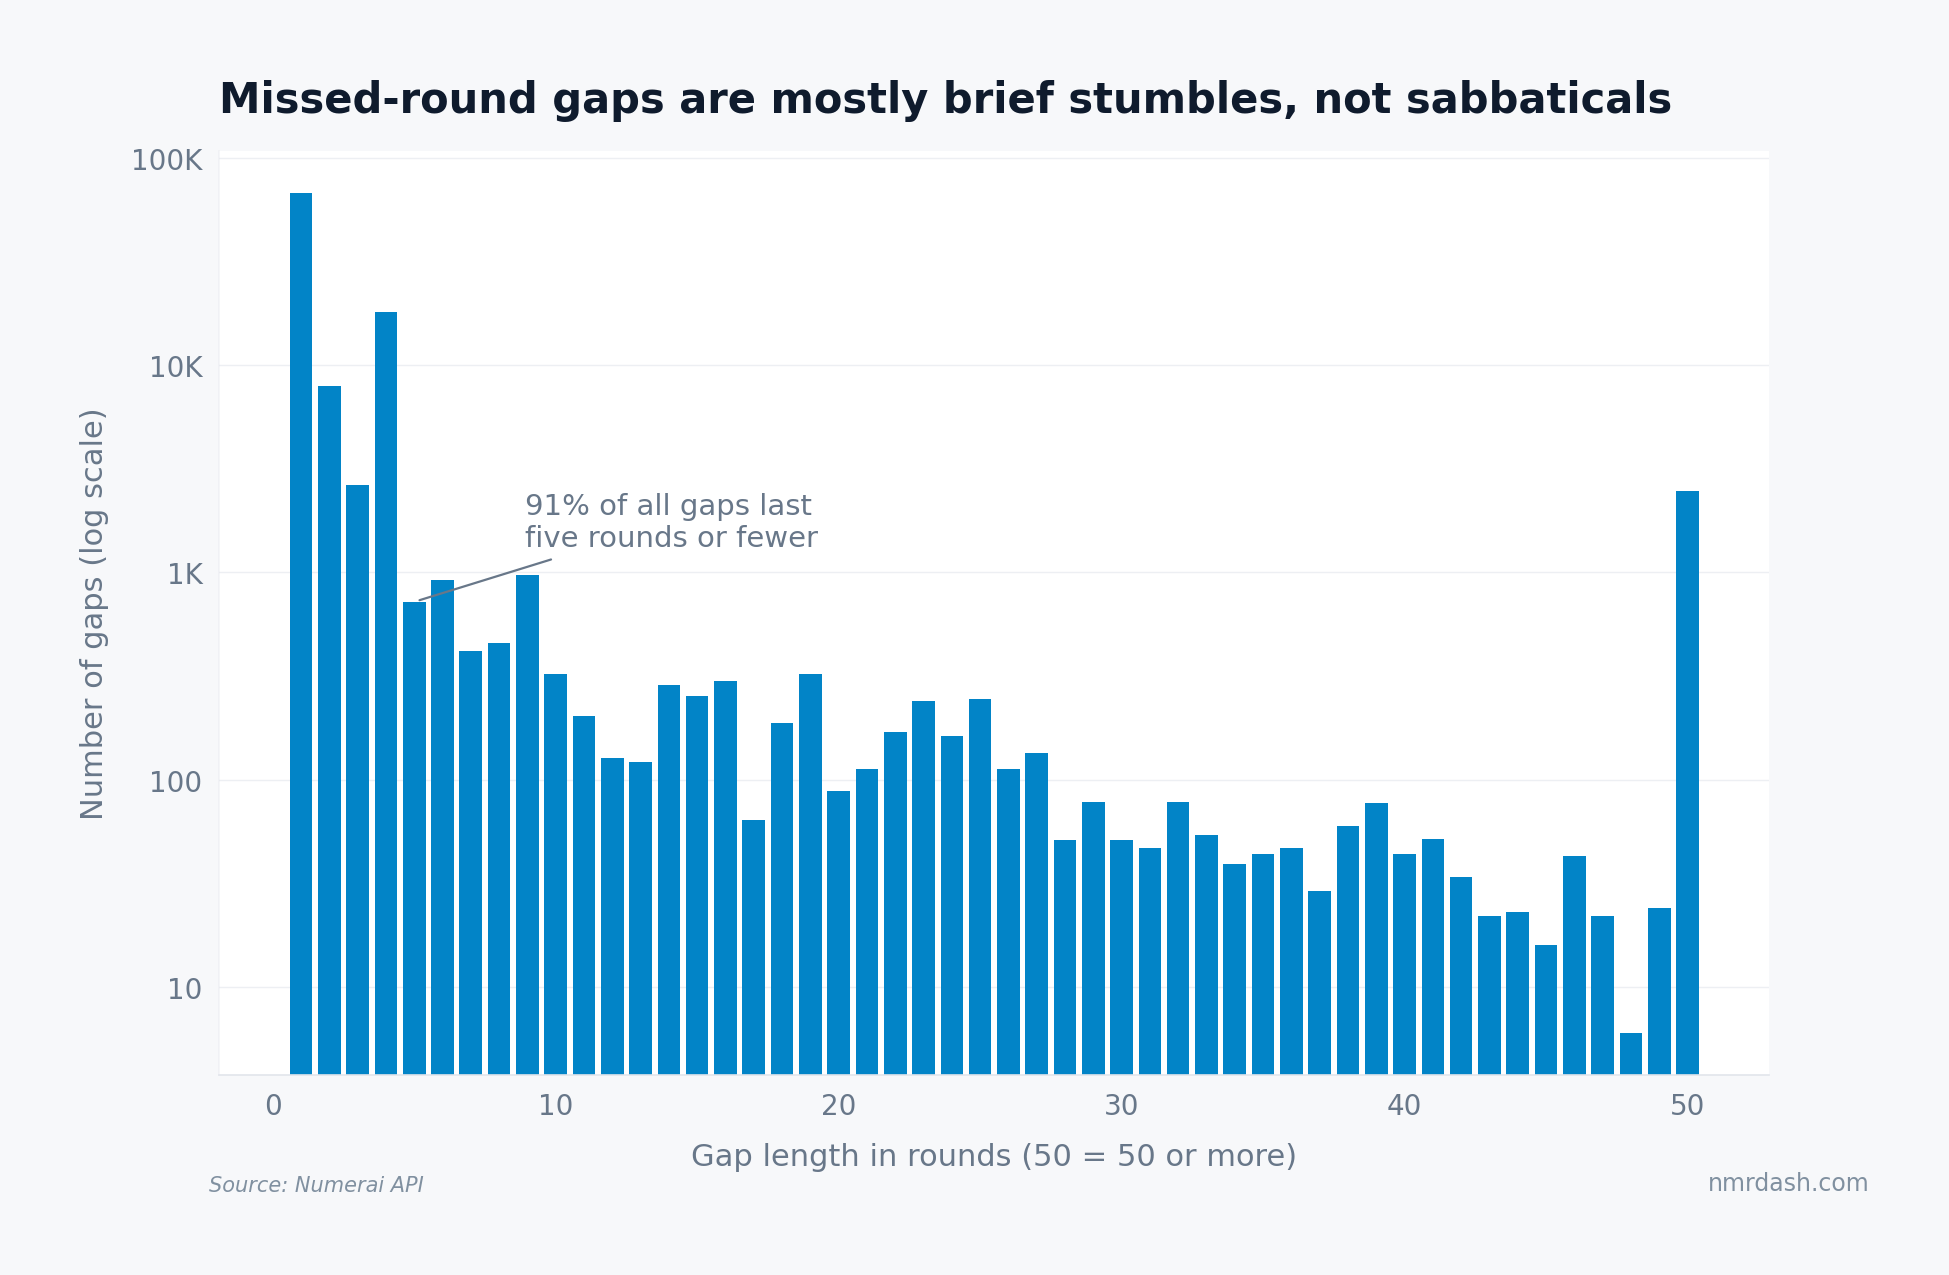
91% of all gaps last five rounds or fewer. With four to five rounds per week, that is less than a calendar week of downtime, exactly what a failed job that someone notices on the weekend looks like. The distribution then decays smoothly, with one exception: a bump of 2,400 gaps at 50+ rounds. Those are true dormancies: models parked for months and revived later, a behavior the dashboard's staker-retention chart counts as "reactivated" stakers on the home page.
The Fleet's Uptime, Round by Round
Aggregating the other direction — per round, what share of mid-span staked models failed to appear? — turns attendance into a tournament health metric.
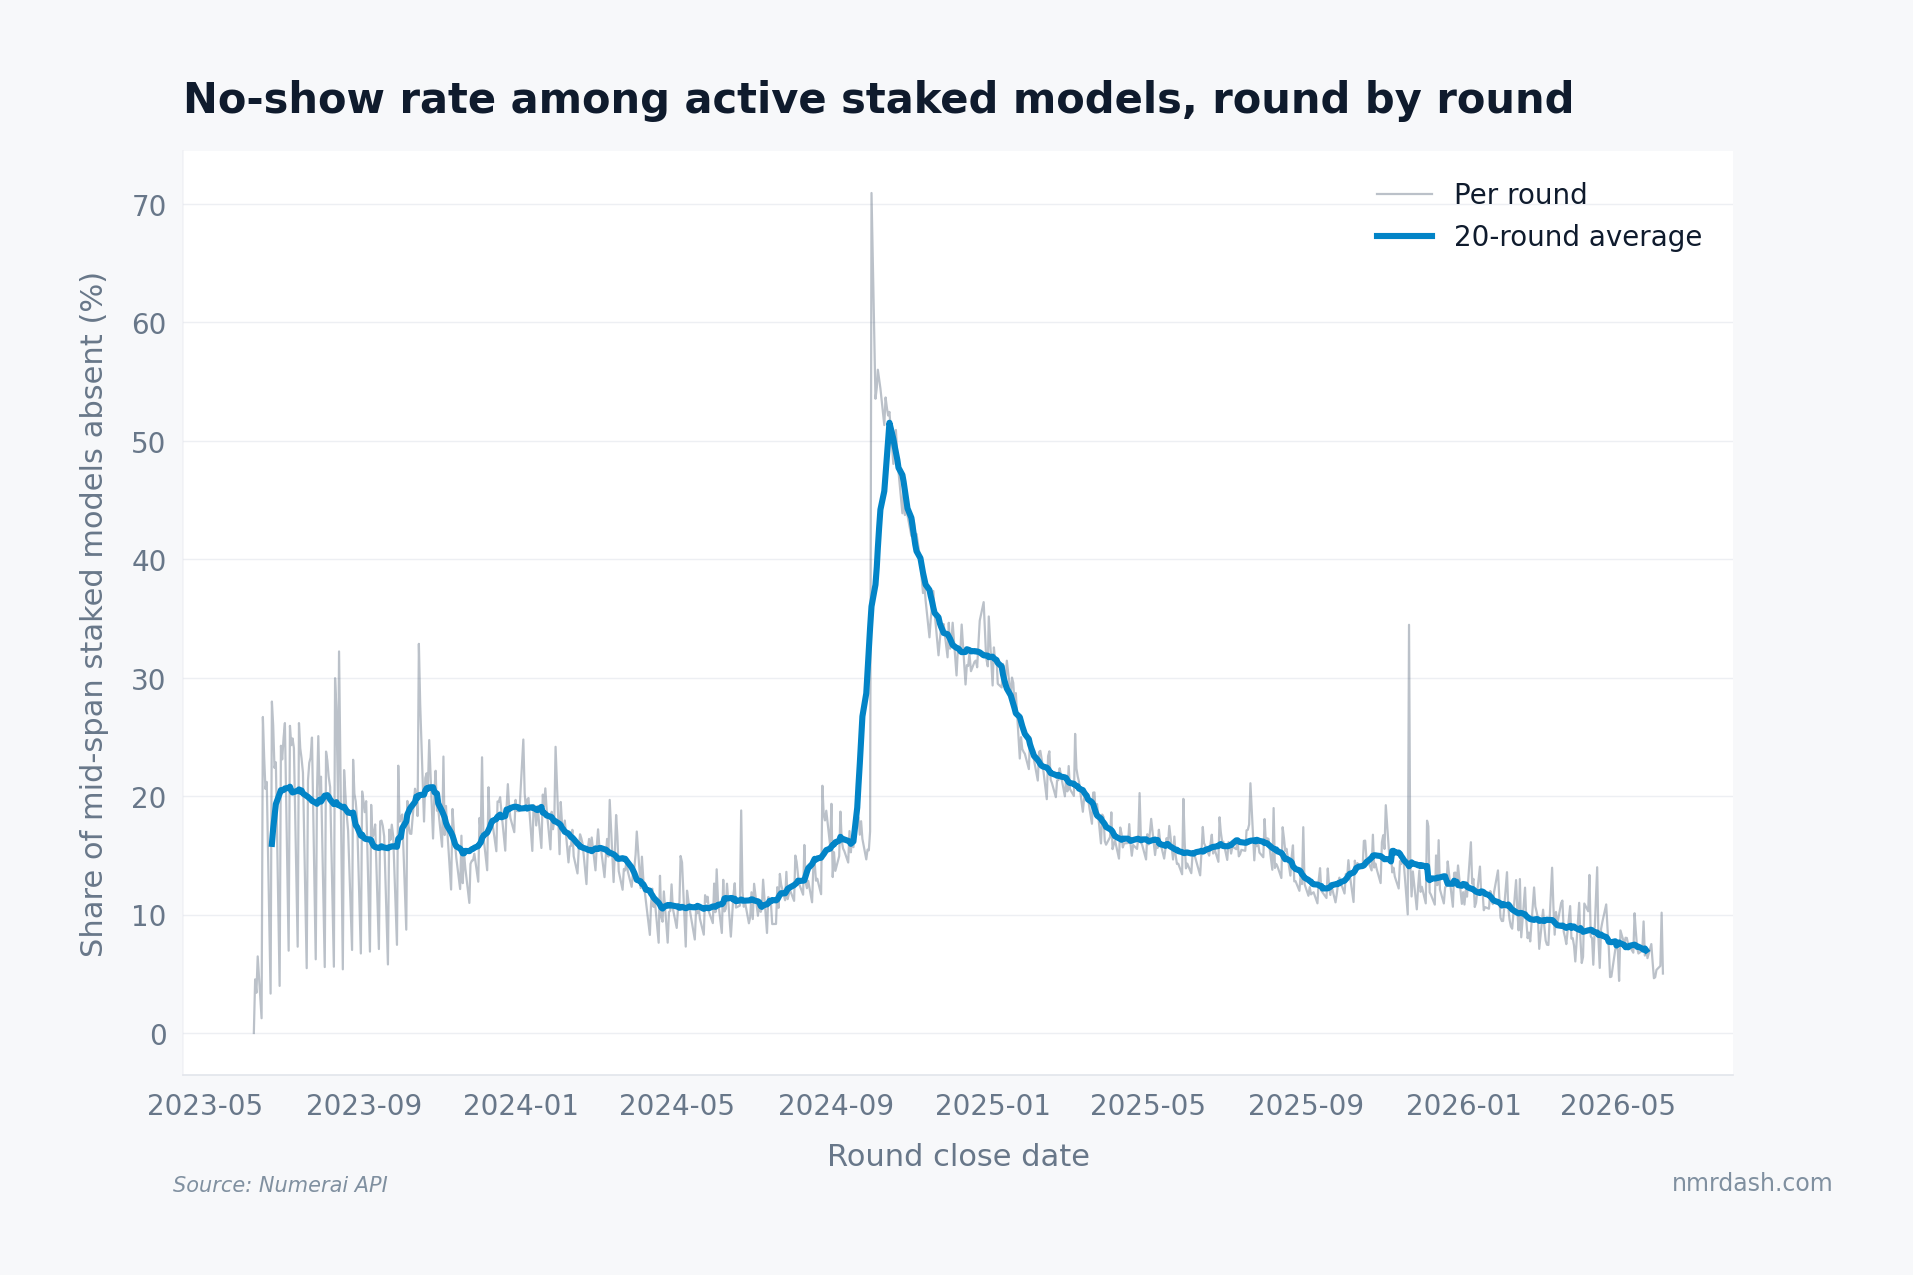
Through 2023 and 2024 the 20-round average no-show rate oscillated between 10% and 20%. Then October 2024 stands out sharply: the average peaked at 51.5% around round 853; for a few weeks, half the models that would normally be present were absent. The timing coincides with the stake pool's deepest trough of that year (see Do Stakers Flee After Burns?); by construction these were models that later returned, so it reads as a mass pause-and-comeback rather than an exodus. Since early 2026 the metric has steadily improved to about 7%, the best sustained level in the dataset. The surviving fleet is more reliable than it has ever been.
Practical Notes
For operators, the numbers set a clear bar: a perfect attendance record is not exceptional, it is the largest single cohort, and the payout table suggests reliability correlates with roughly 2-12 bps per round of extra yield depending on how far attendance slips. Alerting on a missed daily round pays for itself quickly when the alternative is joining the five-round-gap statistics. For tournament watchers, the per-round no-show rate is an underrated health indicator — it caught the October 2024 disruption more sharply than stake totals did, and its current 7% level is a quiet signal of a maturing, automated player base. Participation counts per round are on the trends page.