Numerai Model Survival: Who Lasts and Who Burns Out
Half of new Numerai models go inactive within roughly 200 rounds. Survival curves, cohort payouts, and the early signals that predict who lasts.
Only about 1 in 4 Numerai models make it past 400 rounds after their first submission — and barely 15% past 600. Of the 19,400 models that have ever locked NMR onto a prediction, just 4,683 are still staking today. Every round, good predictions earn and bad ones burn permanently. That economic pressure runs a 76% washout over the lifetime of the tournament.
How fast does the attrition happen, and what separates the survivors from the burnouts?
The Retention Problem
Each round's staker population breaks into four groups:
- Retained — Models that staked last round and staked again this round. The stable core.
- New — Models appearing for the first time with a stake.
- Reactivated — Models that have staked before, skipped one or more recent rounds, and came back.
- Churned — Models that staked last round but did not stake this round. Gone, at least for now.
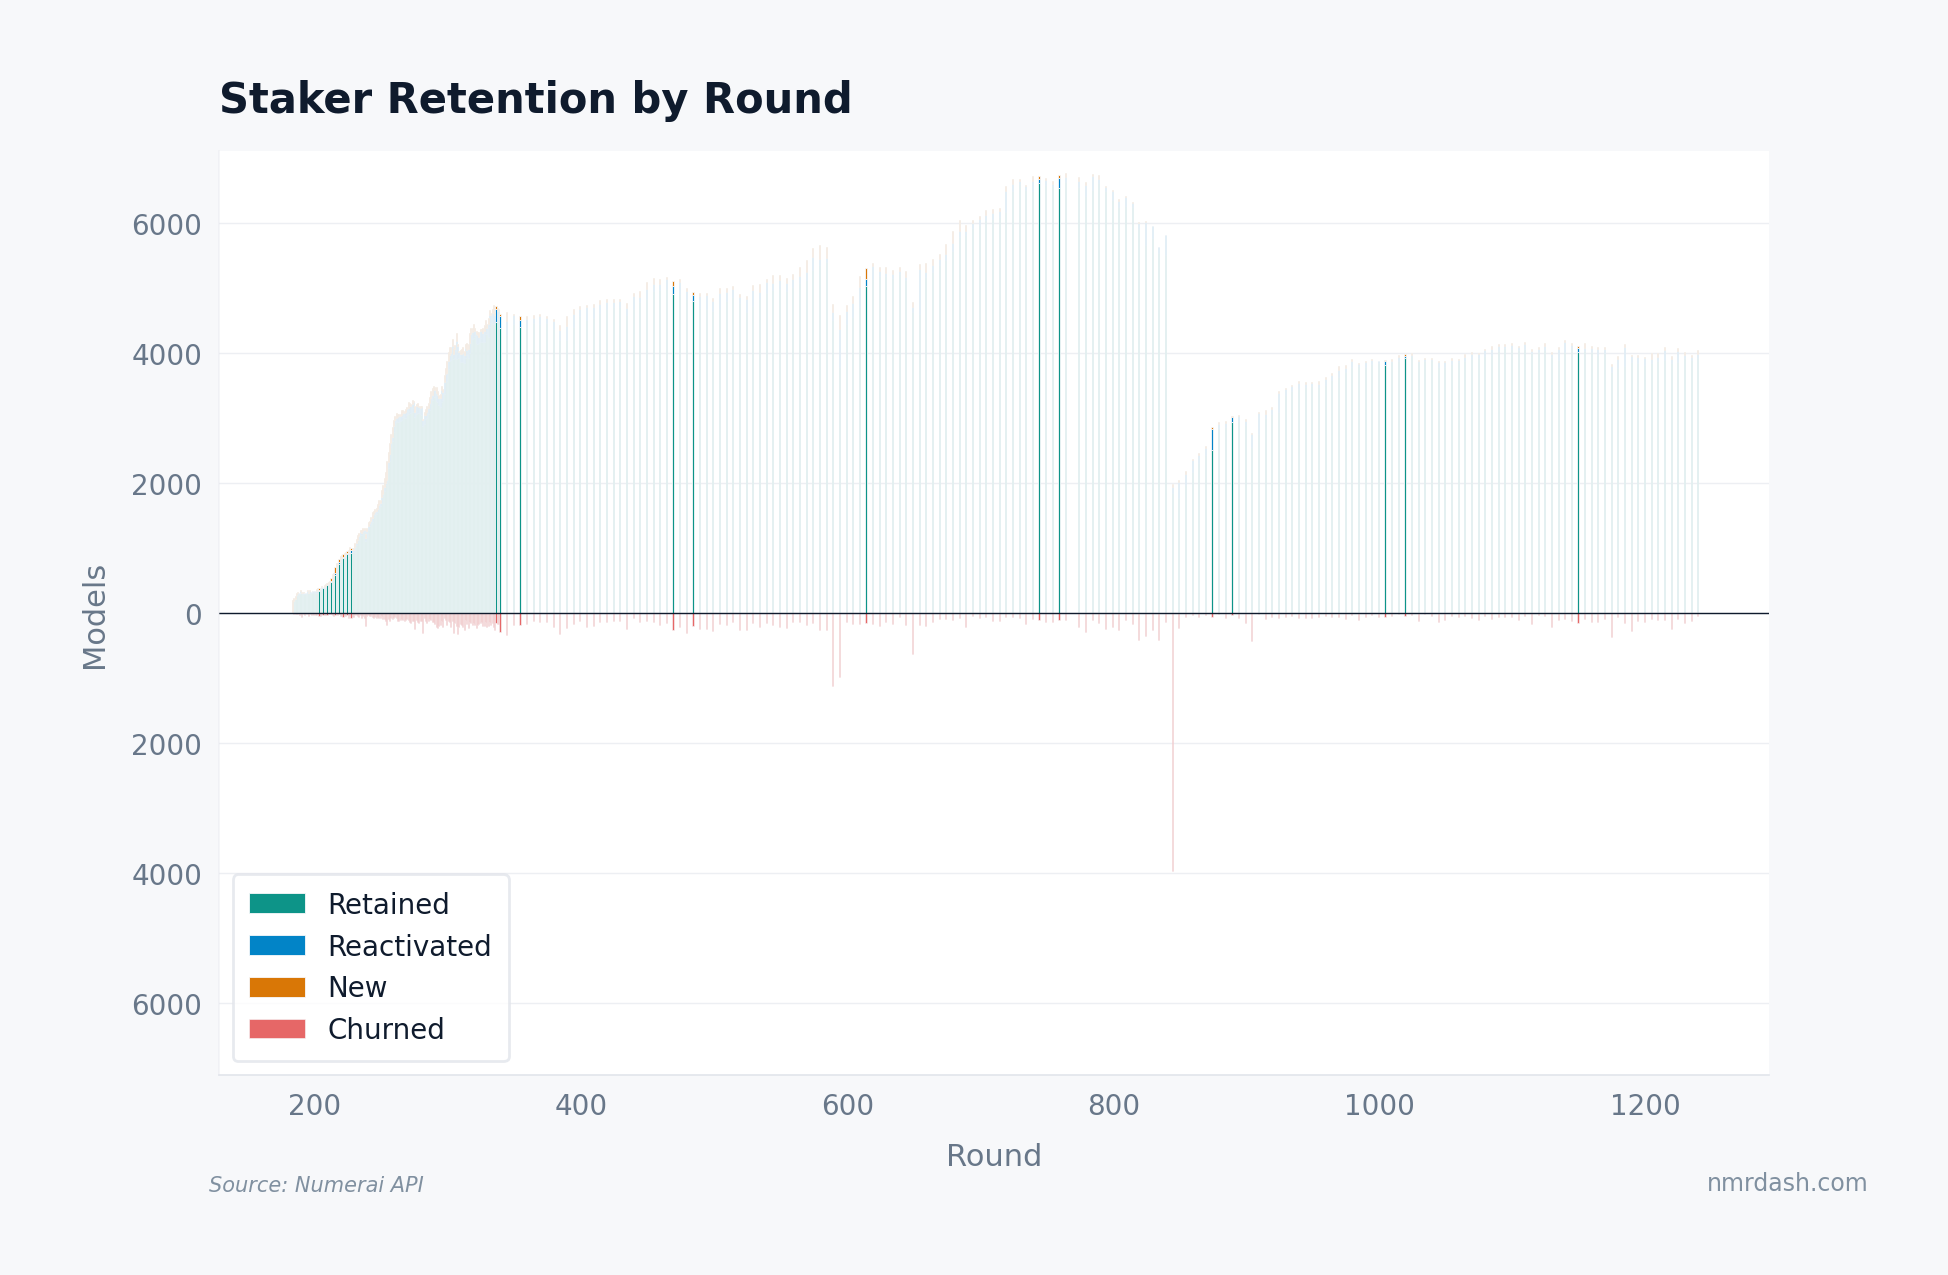
The retention chart shows a stable core. Retained models dominate each round at 4,000 to 6,000, while churn, new entries, and reactivations stay along the margins. Staked model counts peaked near 6,700 around round 750 and have since settled near 4,000.
Churn spikes are visible in the series, but this chart alone does not identify whether losses, payout-factor changes, or operational resets caused them.
How Old Are Current Models?
The age distribution of active models shows the tournament's maturity and its turnover at a glance.
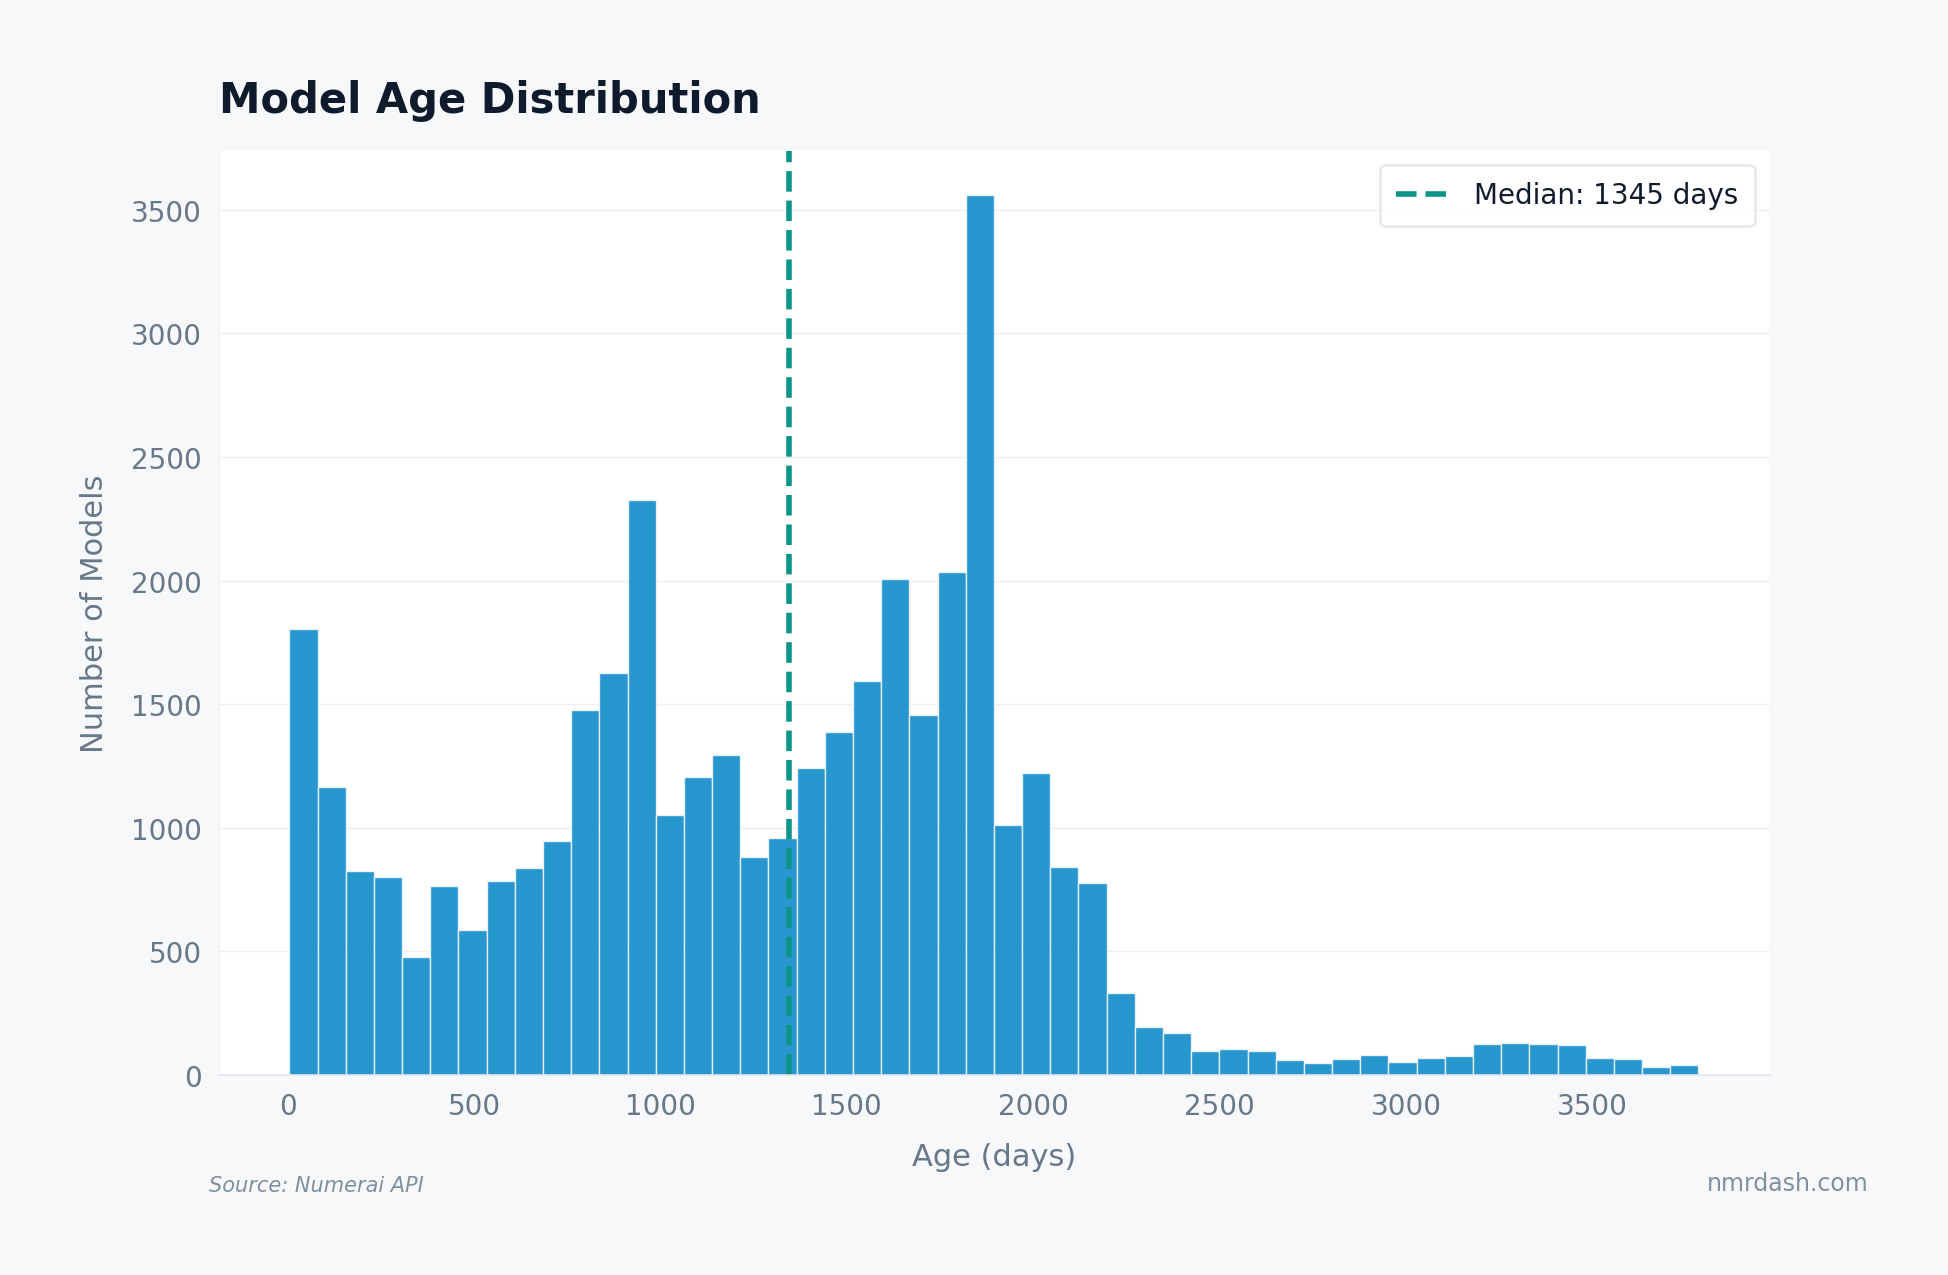
The median active model is 1,345 days old, roughly 3.7 years. The distribution is multi-modal: a cluster of fresh models under 100 days, a broad middle between 800 and 2,000 days, and a long tail past 3,500 days. The tallest bucket sits near 1,850 days, a cohort of veterans who joined during the 2020–2021 growth wave and stayed.
The stake-weighted average age runs higher because older models control disproportionately more capital. The meta-model is shaped more by survivors than by newcomers.
The Survival Curve
Tracking each cohort from its first submission forward produces a survival curve: the percentage of models still active after N rounds.
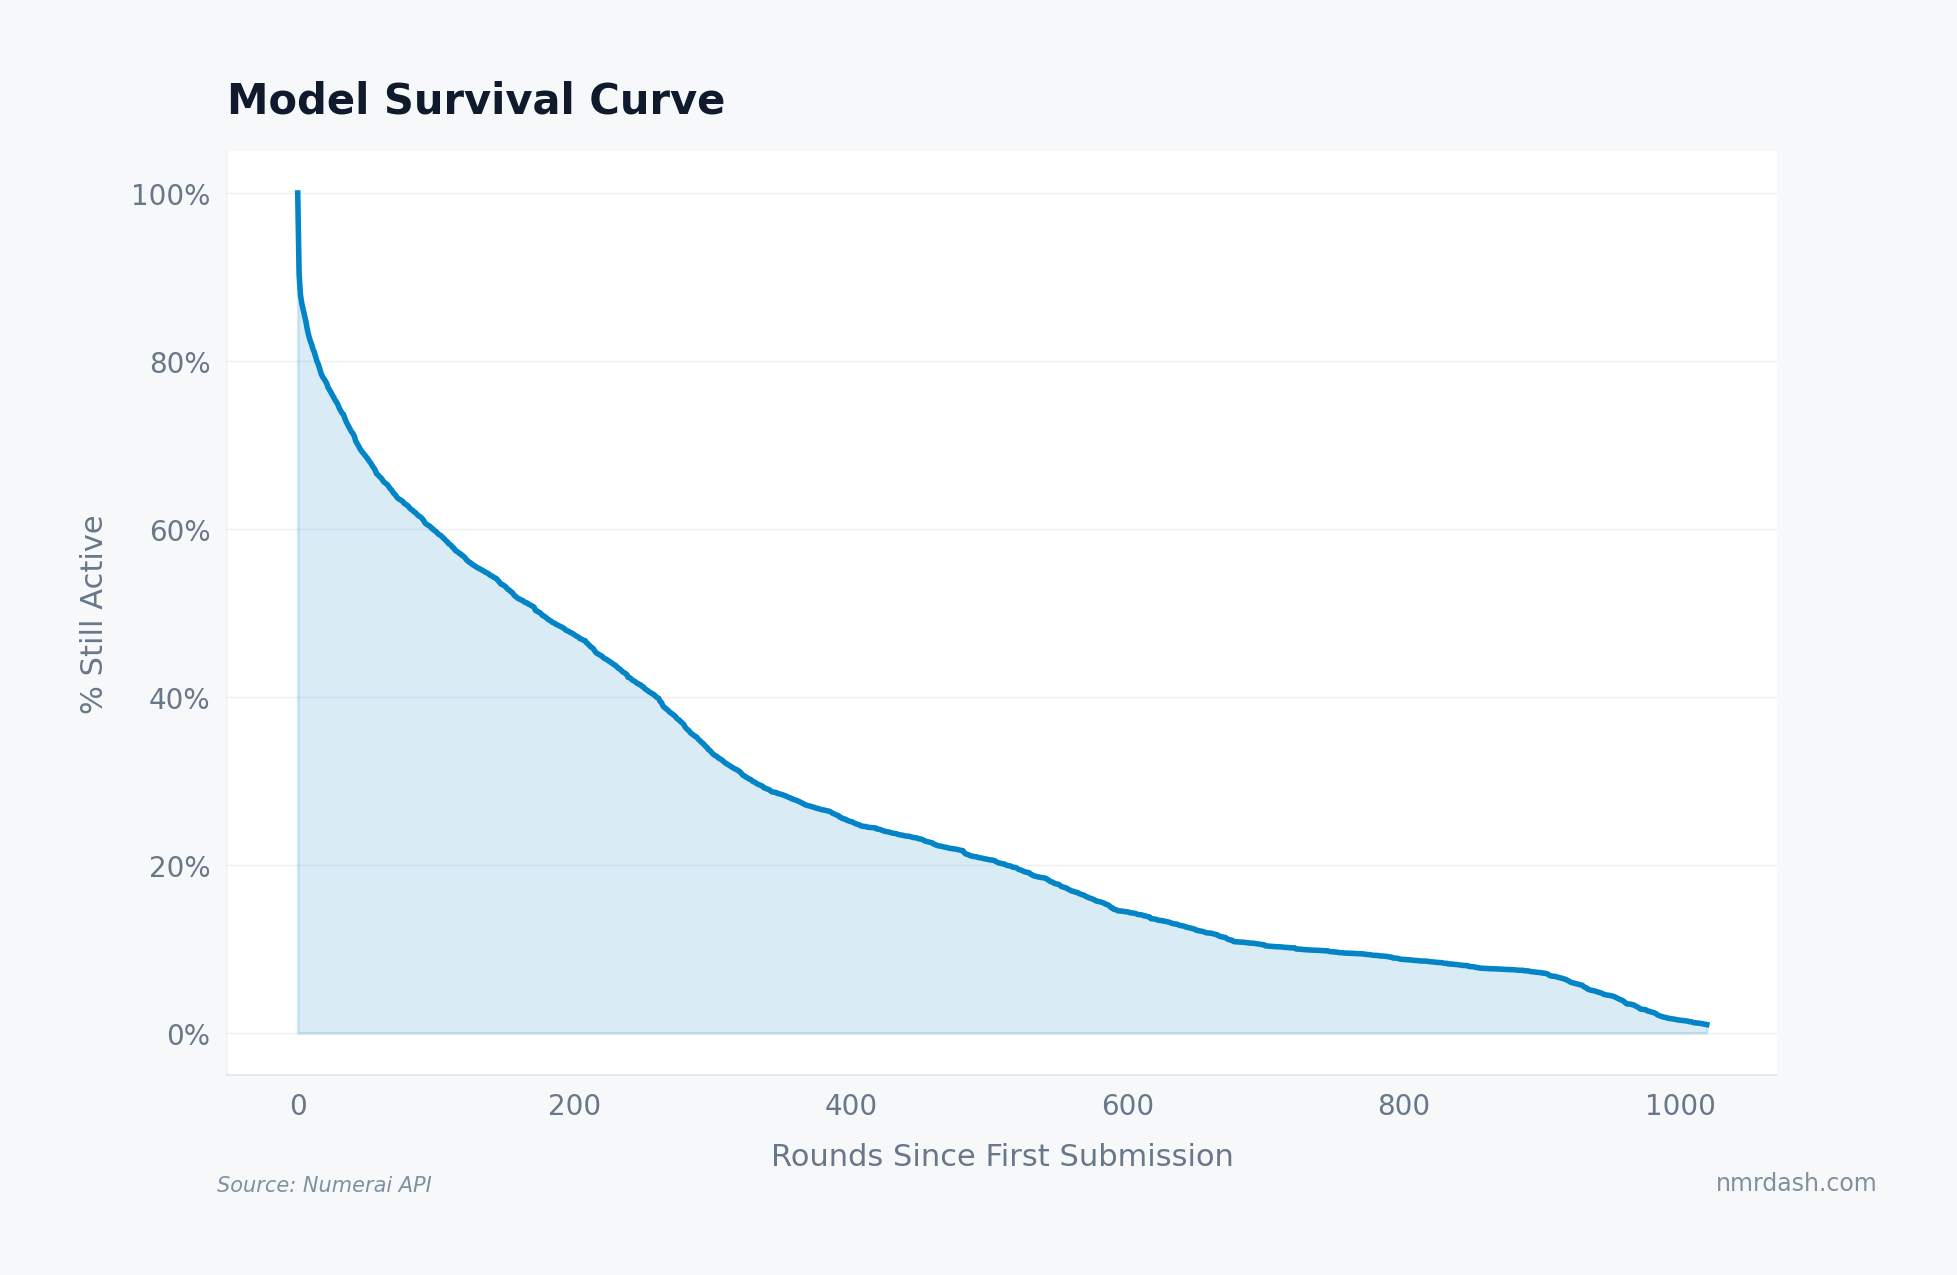
The curve drops fast early. About 30% of new models are gone within the first 50 rounds, and the 50% mark arrives around round 200. By round 400, only about 26% remain, and the curve grinds down through a long tail holding near 10–15% past round 600 before decaying toward zero past round 1,000. Each additional 200-round milestone roughly halves the field: ~50% at round 200, ~26% at 400, ~15% at 600, under 10% by 800.
Models that clear the first year have meaningfully better odds of long-term survival. The first 30 rounds are the steepest portion of the drop, and the early months act as a proving ground.
Several factors drive the early attrition:
- Unrealistic expectations. New participants often expect consistent positive returns. The reality is that even good models have extended drawdown periods.
- Insufficient stake management. Starting with too much stake relative to your confidence level means a few bad rounds can be psychologically or financially devastating.
- Overfitting. Models that looked great in backtesting but fail on live data lose stake fast, and their operators lose motivation faster.
Payout Accumulation by Cohort
Older cohorts accumulate more total payout, but the chart needs a caveat.
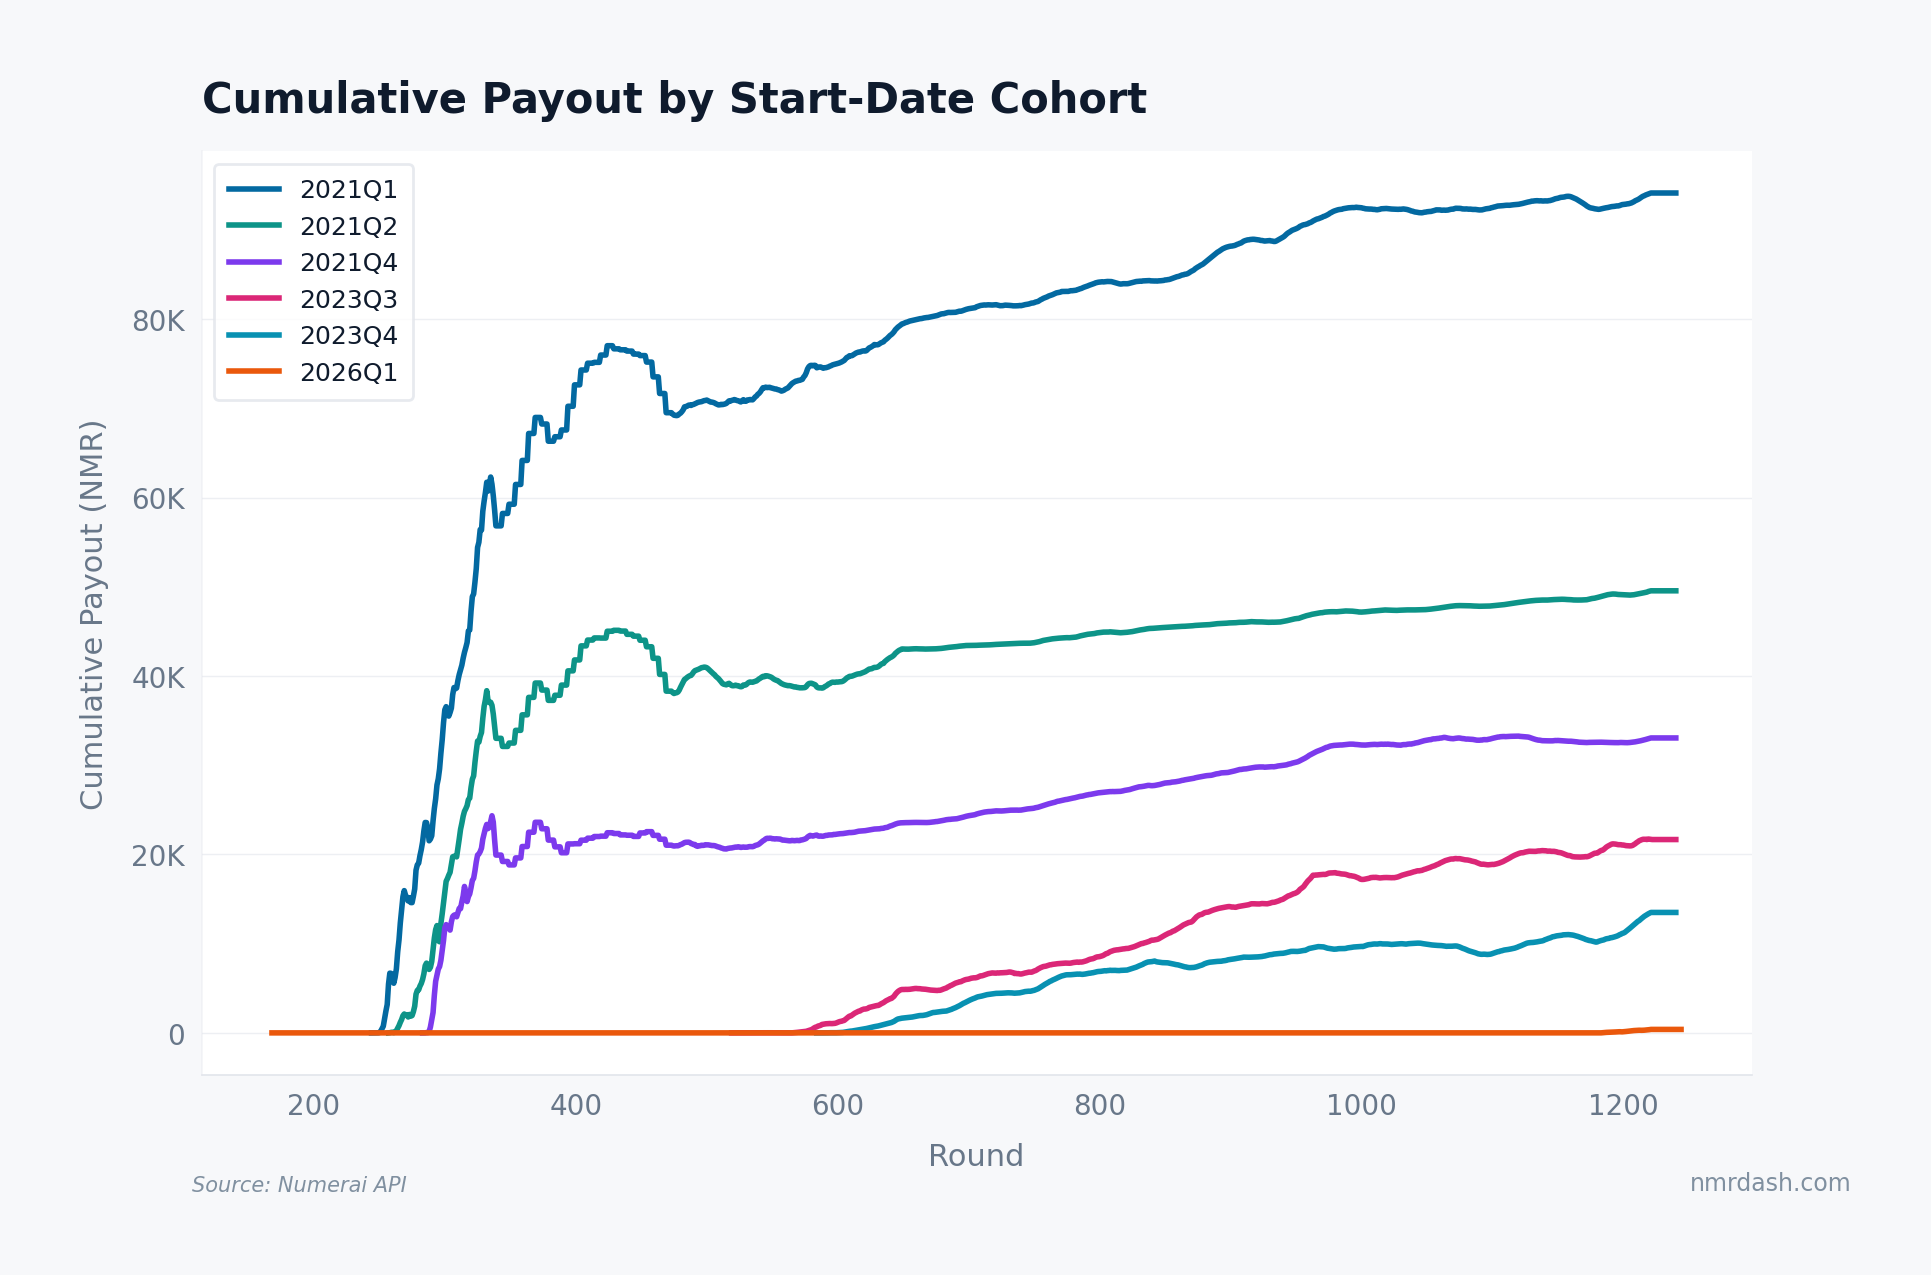
Earlier cohorts show higher cumulative payouts. Part of that is mechanical: they have had more rounds to accumulate. But the 2021Q1 cohort also accumulates faster, reaching about 90,000 NMR while the 2021Q2 through 2023Q4 cohorts top out between roughly 13,000 and 50,000 NMR. Larger average stakes and better-tuned models both play a role.
Survivor bias matters here. A cohort's cumulative payout only counts the models still active. Models that burned through their stake are absent from the later points, so older cohorts look uniformly profitable because their unprofitable members have already been filtered out.
The bias is baked into the tournament's design. Staking is an economic selection process: value-destroying models lose stake and drop out, while value-creating models grow their stake and gain influence. That selection process shifts influence toward models that have survived live staking pressure.
What Predicts Survival?
A few patterns are consistent with models clearing the early washout, though this article does not isolate them causally:
Moderate initial stakes. Models that start small and scale up as they prove themselves survive at higher rates than models that go all-in from day one. Downside protection matters more than upside capture in the early rounds.
Positive MMC early. MMC (Meta Model Contribution) measures the unique signal a model adds on top of the meta-model. Models with above-median MMC in their first 10–20 rounds are much more likely to still be active 100 rounds later. It is the closest thing the tournament has to a signal of genuine alpha.
Consistency over magnitude. Steady, modest positive scores beat high variance, even when the high-variance models post a higher average. Large drawdowns cause exits regardless of long-term expected value.
Diversification across metrics. Models that score well on multiple metrics — MMC, CORJ60, and FNCv3, all visible on the models page — hold up better across changing market regimes than models optimized for a single metric.
Takeaways for New Participants
The survival data suggests a few practical strategies for new participants:
- Start small. Use the minimum stake or close to it for your first 20–30 rounds. Treat the period as calibration, not profit generation.
- Watch your MMC. If your MMC is consistently negative in the first few months, your model is not adding unique value. Iterate before scaling stake.
- Plan for drawdowns. The best models have had multi-month losing streaks. If a 10-round drawdown would cause you to quit, your stake is too high.
- Don't chase the leaderboard. The models at the top of the leaderboard are survivors with hundreds of rounds of compounding and earned medals. Compare your model's metrics to the population median, not the top 10.
- Track your retention category. Repeatedly landing in the "reactivated" bucket — staking, leaving, coming back — usually ends in permanent churn. Commit to a consistent staking schedule or reduce your stake to a level you can sustain.
The tournament rewards patience and discipline as much as modeling skill. Most models don't survive. The ones that do were built by participants who treated the first few months as a learning investment, not a lottery ticket.