Do Numerai Stakers Flee After Burns? An Event Study
After 1,055 Numerai round resolutions, worst-decile burns dent the stake pool about 1.3% for six weeks. Voluntary flows, not payouts, move the pool.
Every Numerai burn round raises the same question in chat: will stakers pull their NMR now? The stake pool data gives a measurable answer. Anchoring each resolved round at the moment its result lands (resolution, roughly 30 days after close) and tracking the total stake pool over the following weeks shows that stakers barely move. The worst decile of burns knocks about 1.3% off the pool over the next month, and even that dent fades within ten weeks.
The setup: for every resolved Classic round with stake, compute its net payout ratio (earned minus burned, over stake at risk). Then sample the total NMR at stake at each subsequent weekly round open. Because outcomes only become visible at resolution, all event clocks start there, not at the round's close.
The Long View: Burns Barely Register
First, the raw picture — the stake pool with the worst 5% of burn resolutions marked.
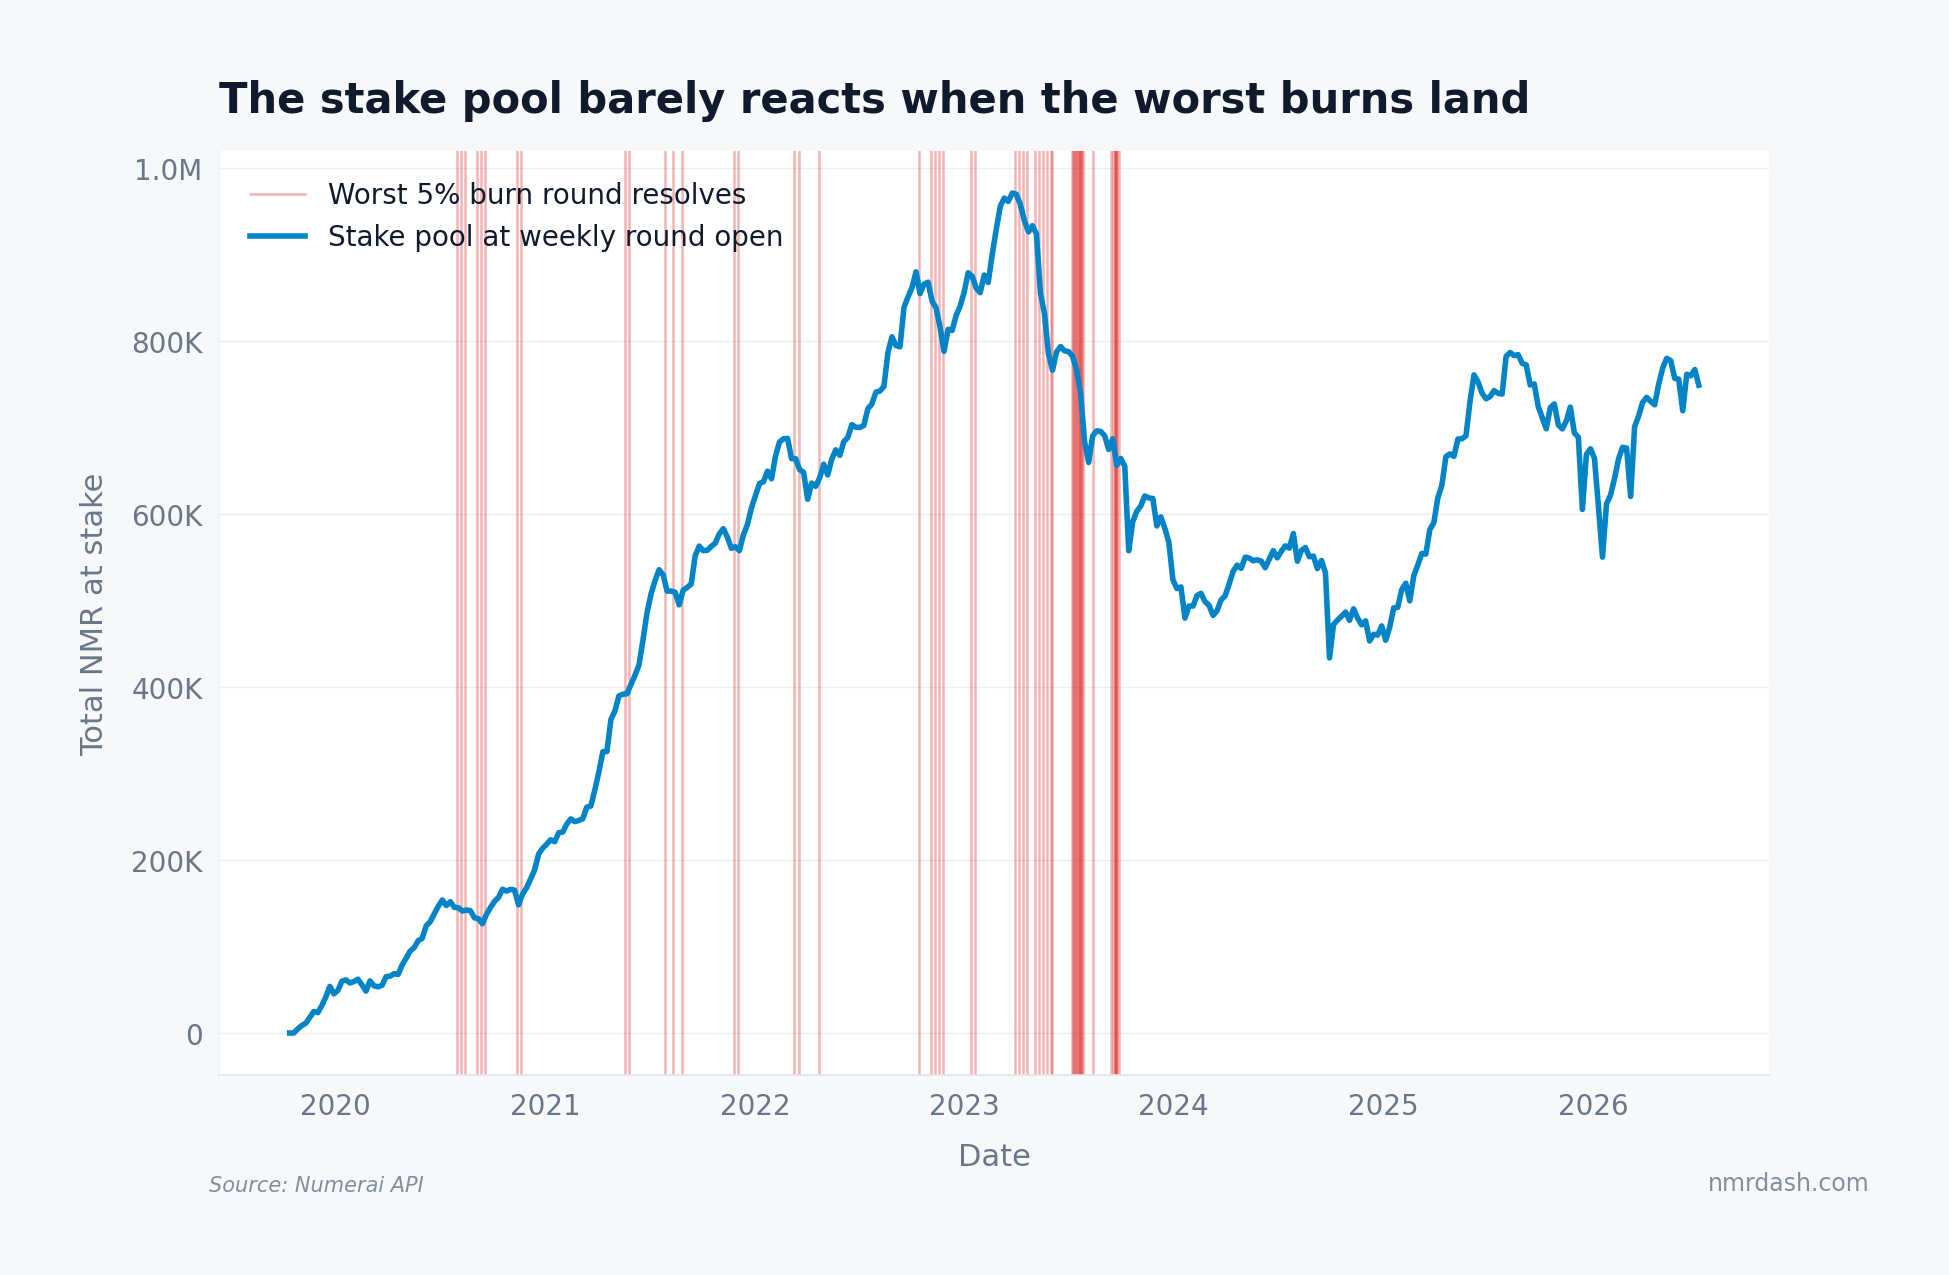
The pool's big moves — the 2021-22 climb to near 1M NMR, the 2023-24 decline, the 2025 recovery — do not line up neatly with burn events. The dense cluster of red marks in mid-2023 sits inside a decline that had already started, and the deepest pool trough (433K NMR, late 2024) arrives more than a year after the worst burn cluster. For the burn history itself, see Anatomy of a Numerai Burn Streak.
The Event Study: A Dent, Not an Exodus
Averaging the pool's path after every resolution, split by outcome decile, isolates the reaction.
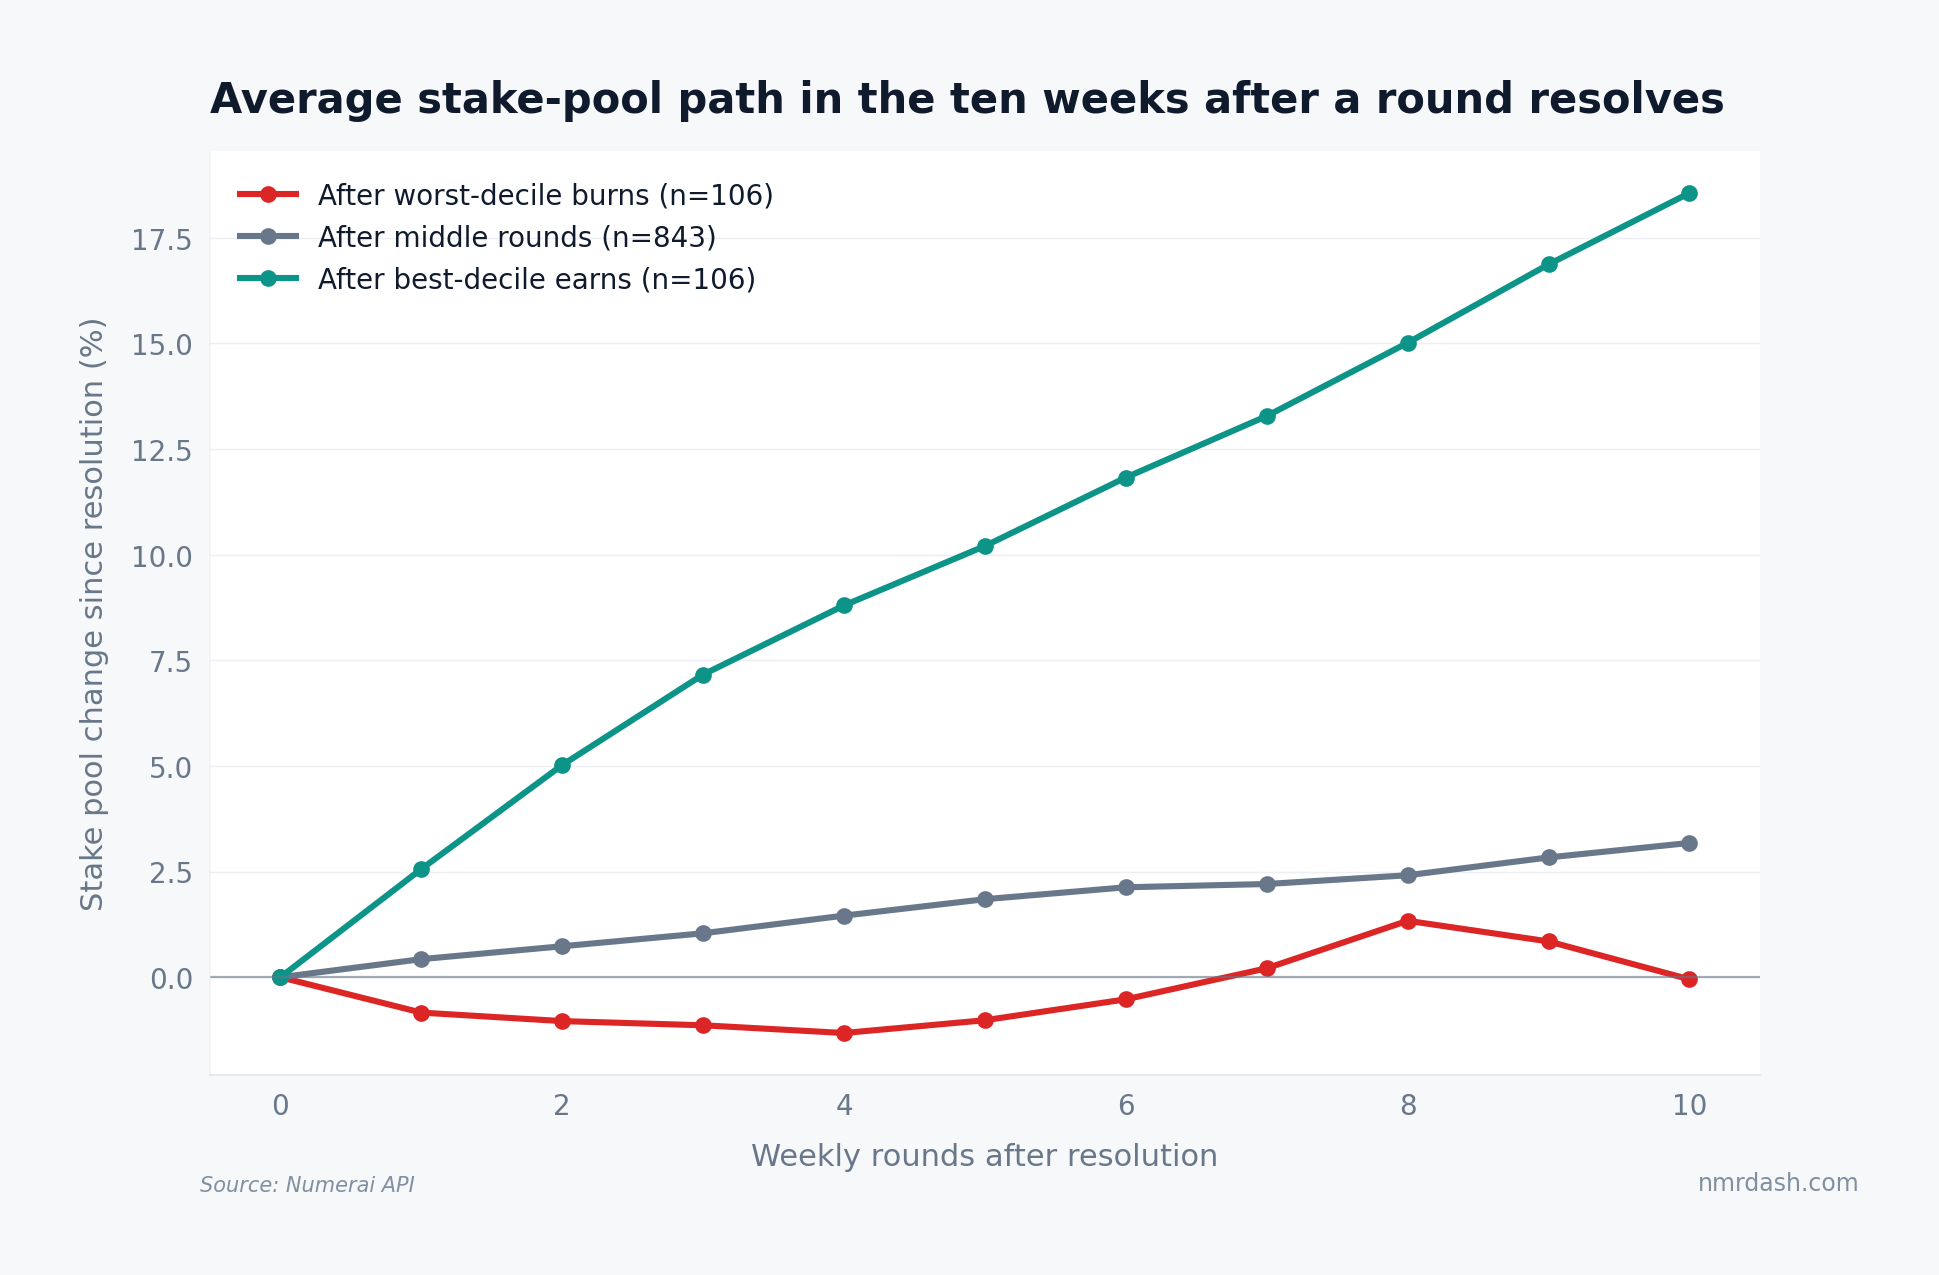
After a worst-decile burn (106 events), the pool drops roughly 1.3% over the next four weekly rounds, stays down through week six, and is back to flat by week ten. After a typical round, it drifts up 1.5% over four weeks. The gap between those two paths — about three percentage points — is the honest estimate of burn-driven outflow, and it is comparable in size to the burns themselves, which run as deep as 4% of stake in the worst round.
One caveat on the top line: the +18.6% ten-week path after best-decile earns mostly reflects when those rounds happened. Huge net-earn ratios cluster in 2020-21, when the pool was growing fast for reasons that had nothing to do with any single round. Read that line as era, not incentive.
Round by Round, the Signal Is Weak
The scatter below drops the hyper-growth era entirely and correlates each 2022+ round's outcome with the pool's change over the following four weekly rounds.
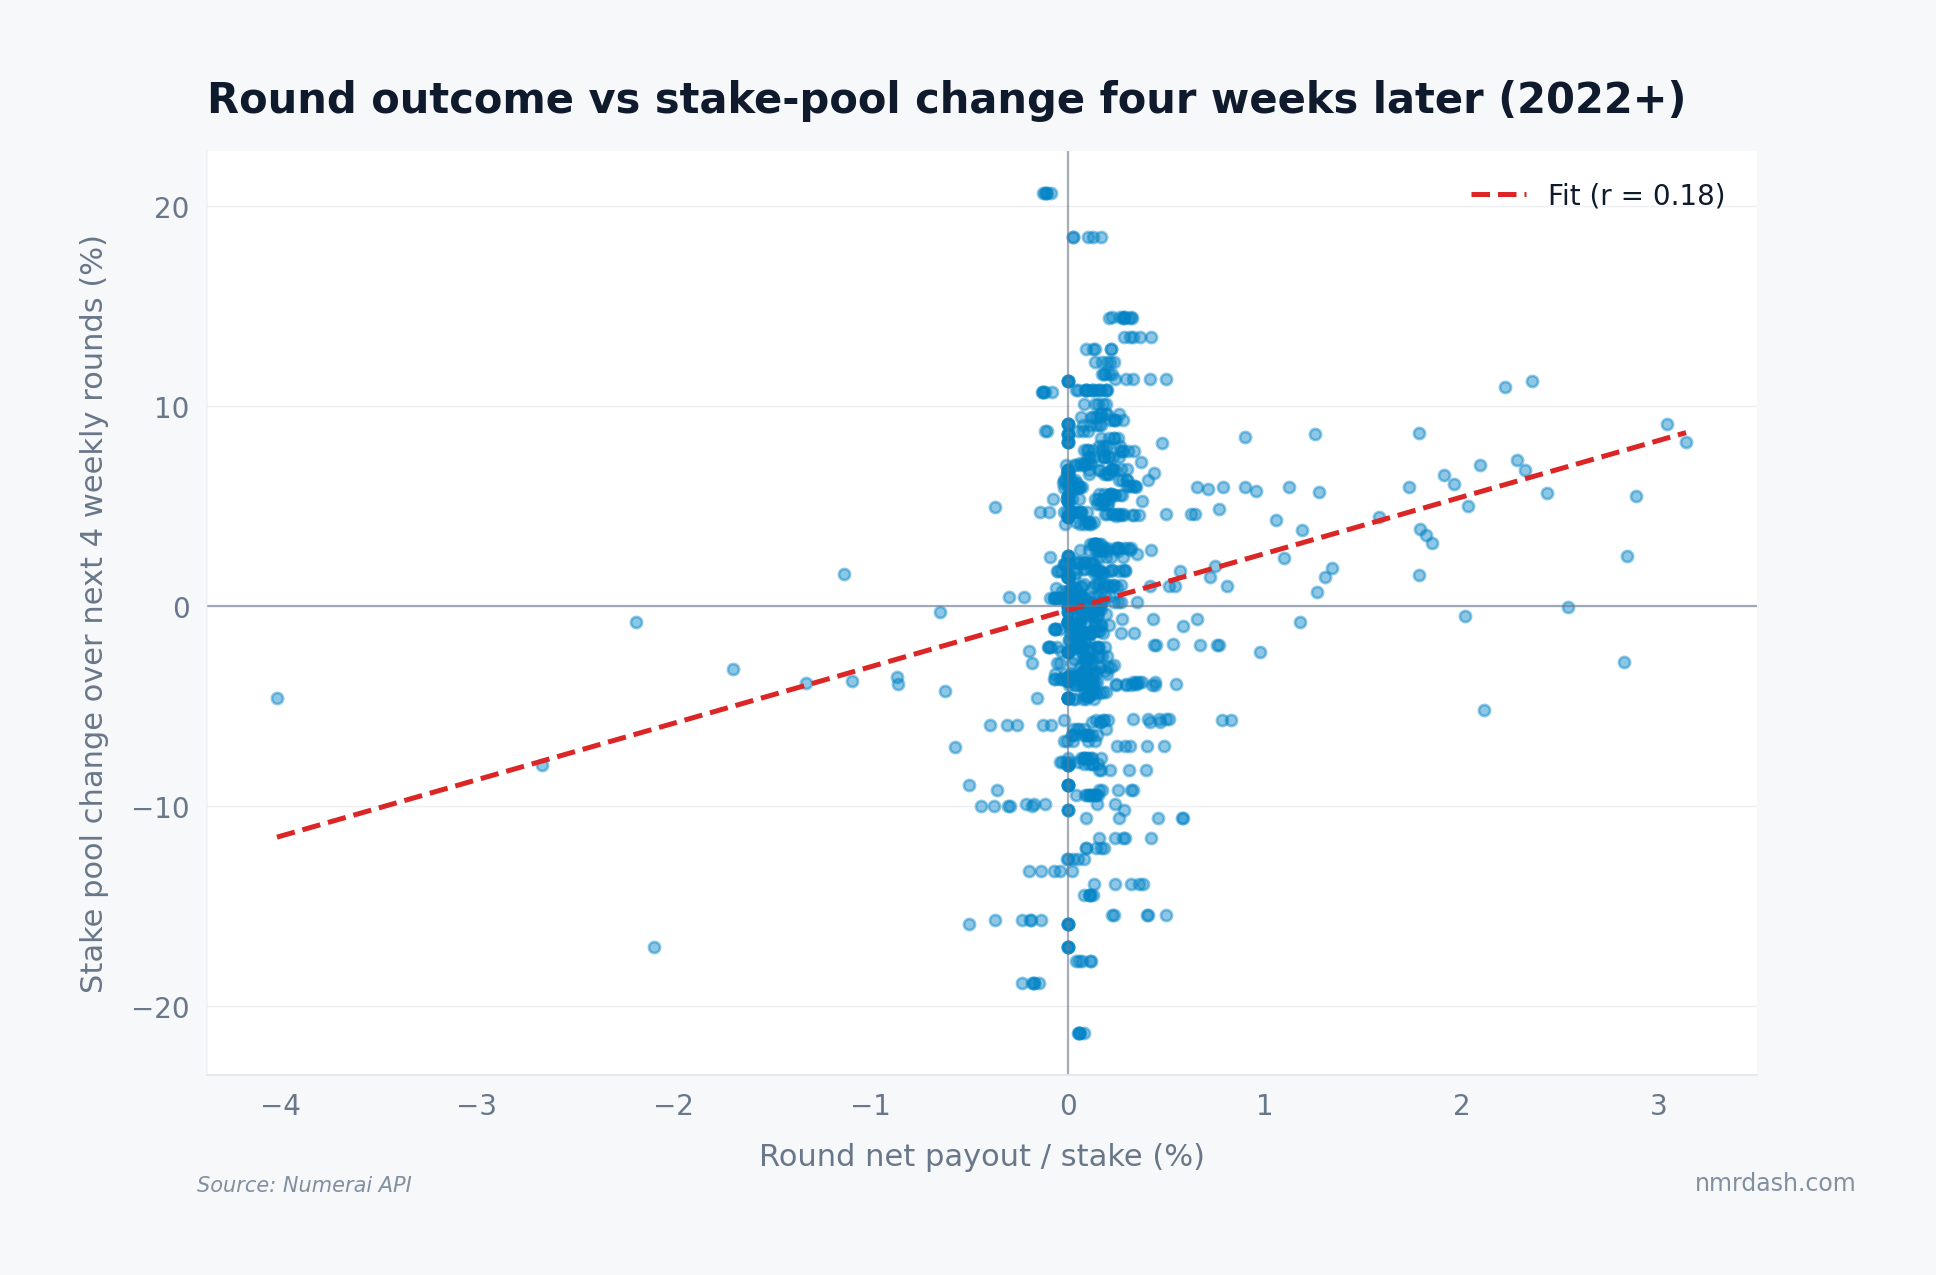
The correlation is positive but weak: r = 0.18 across 973 rounds. Outcomes explain about 3% of the variance in what the pool does next month. Everything else (NMR price, model launches and retirements, the individual whale decisions tracked in Stake Flows) swamps the burn signal.
What Actually Moves the Pool
Splitting each month's pool change into protocol payouts (earned minus burned, settling that month) versus everything else (voluntary staking and unstaking) settles the question of agency.
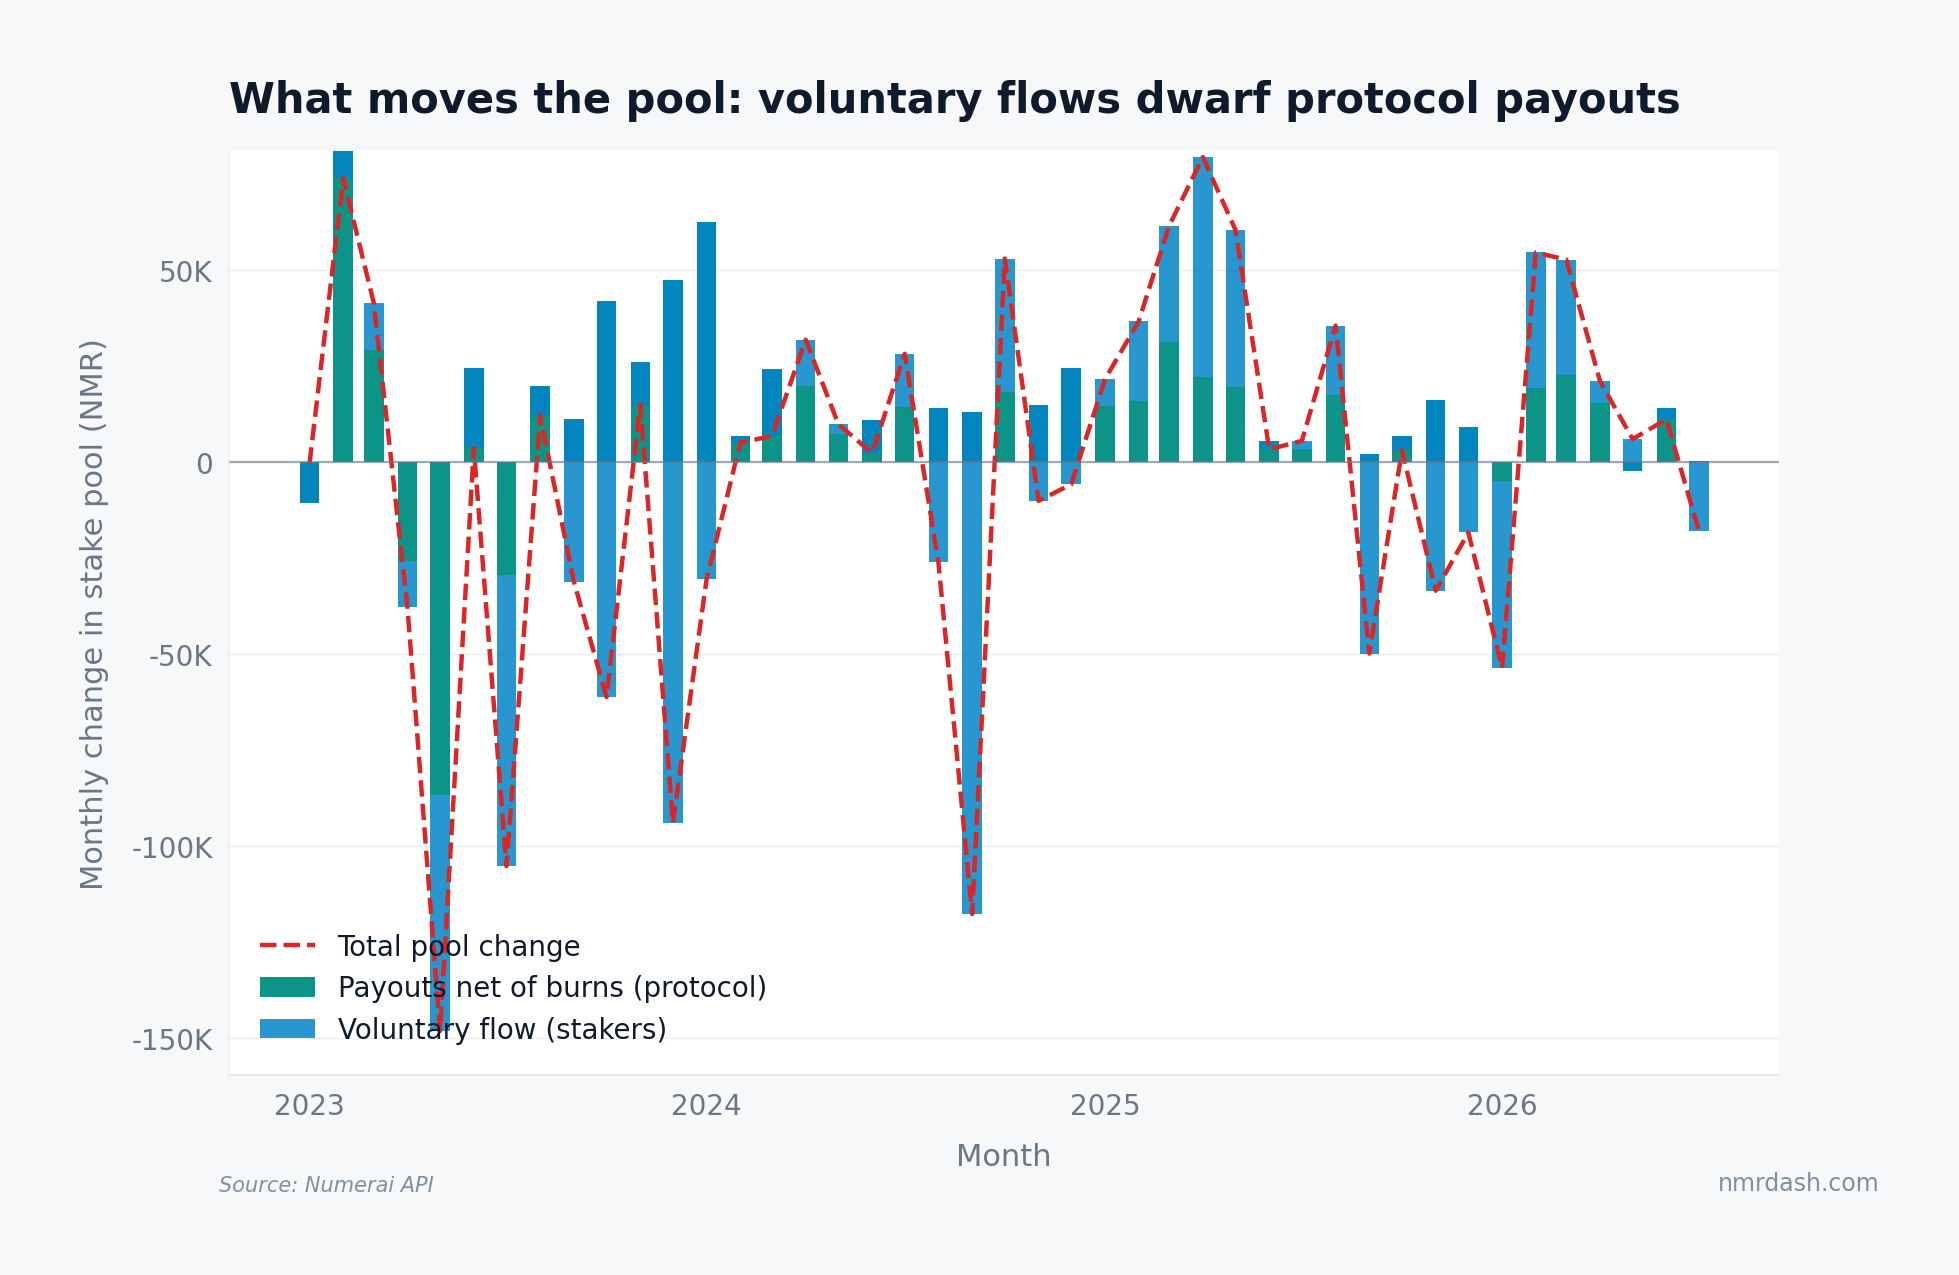
Voluntary flows dominate. In a typical month since 2023, deposits and withdrawals move several times more NMR than payouts and burns do; the ±100K NMR swing months of 2023-24 were almost entirely stakers choosing to leave or arrive, not the protocol clawing stake back. The burn mechanism, for all its psychological weight, is a small direct force on the pool; its power is indirect, through the decisions it provokes. On this evidence, those decisions are more shrug than stampede.
Takeaways
For stakers: the market you compete against does not de-risk after community-wide burns, so a burn season is not systematically followed by a thinner (easier) pool. For observers of tournament economics: pool trends are a sentiment-and-price story, not a payout story. Watch voluntary flows, not burn totals. And for anyone modeling the tournament: a ~1.3% four-week dent per tail burn, decaying to zero by week ten, is a usable empirical prior for how much capital flight a bad round actually causes.