Metric Convergence: Is Numerai Becoming a Monoculture?
MMC and BMC now agree at 0.95+ and MMC dispersion has compressed ~45%, but sign agreement has been flat for 900 rounds. The monoculture evidence is mixed.
Numerai's scoring system rewards diversity. MMC pays for originality, CORJ60 for accuracy, BMC for benchmark contribution, FNCv3 for feature-neutral signal. If these metrics move independently across the field, the tournament has genuine strategic breadth. If they become more correlated, the field may be narrowing toward a smaller set of successful approaches.
This post measures convergence from four angles: cross-metric correlation, cross-sectional dispersion, metric dominance, and sign agreement.
Cross-Metric Correlation: Are the Metrics Collapsing?
For each round, compute the Spearman rank correlation between every pair of primary metrics across all staked models. A rolling 50-round average smooths the noise and reveals the trend.
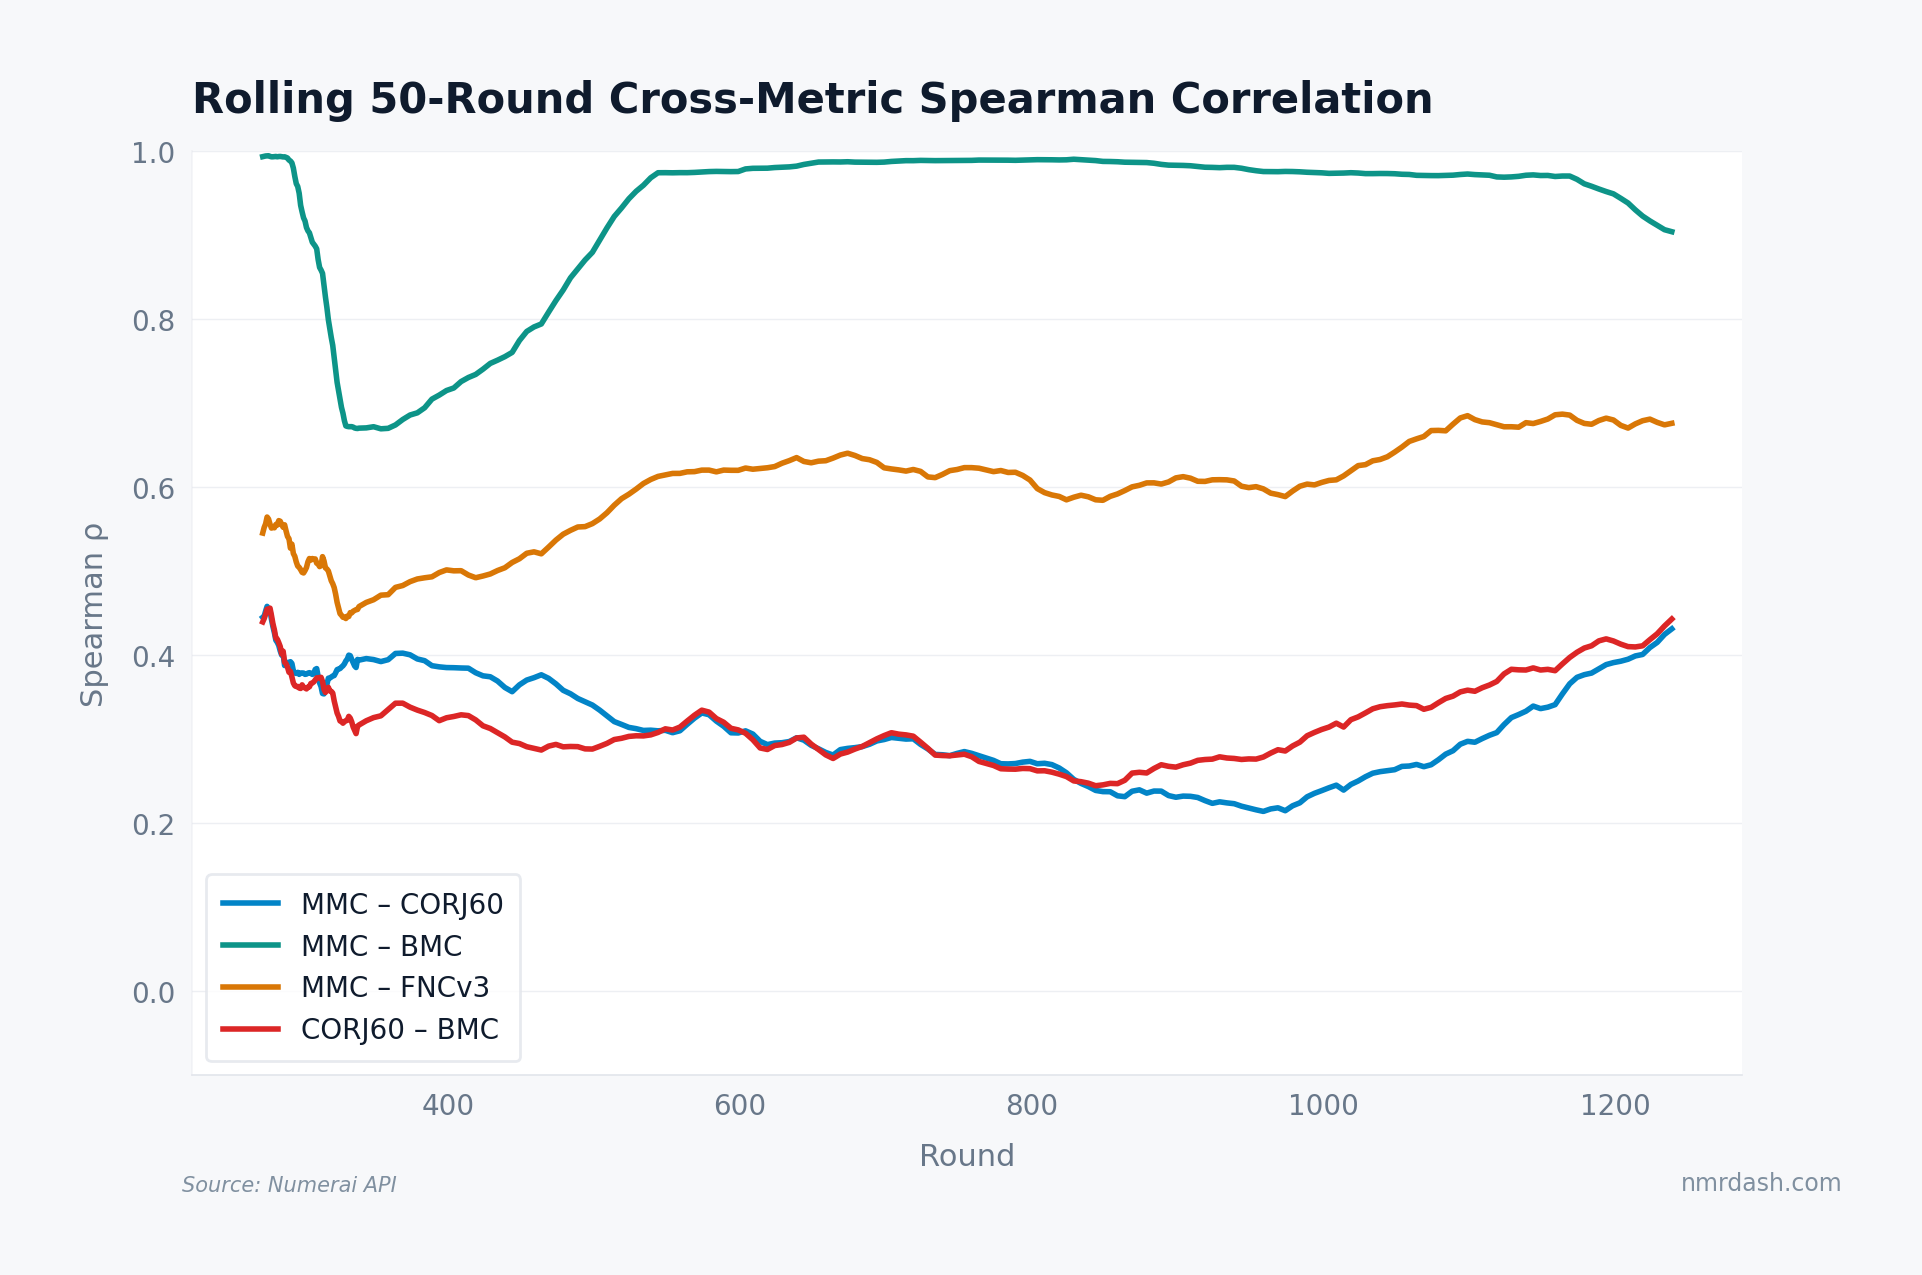
The MMC-CORJ60 correlation is not a one-way climb. It started near 0.45 around round 300, drifted down to roughly 0.22 by rounds 900–1000, then recovered to about 0.43 in the most recent rounds: all of the convergence in this pair is concentrated in the last 250 rounds. The starker signal is MMC-BMC: outside a dip to 0.67 around round 340, it has run between 0.95 and 0.99 since round 550, meaning a model's "originality" score and its "benchmark contribution" score are now nearly the same number, even though they were designed to capture different things. MMC-FNCv3 climbed from roughly 0.45 to 0.68 over the same stretch.
When metrics designed to measure different qualities agree this closely, and the recently-decorrelated pairs turn back upward, the scoring system is rewarding a narrower band of approaches than the metric names suggest.
Dispersion: Is the Field Narrowing?
Cross-sectional standard deviation measures how spread out model scores are within each round (smoothed here with a 20-round average). High dispersion means varied strategies; low dispersion means bunching.
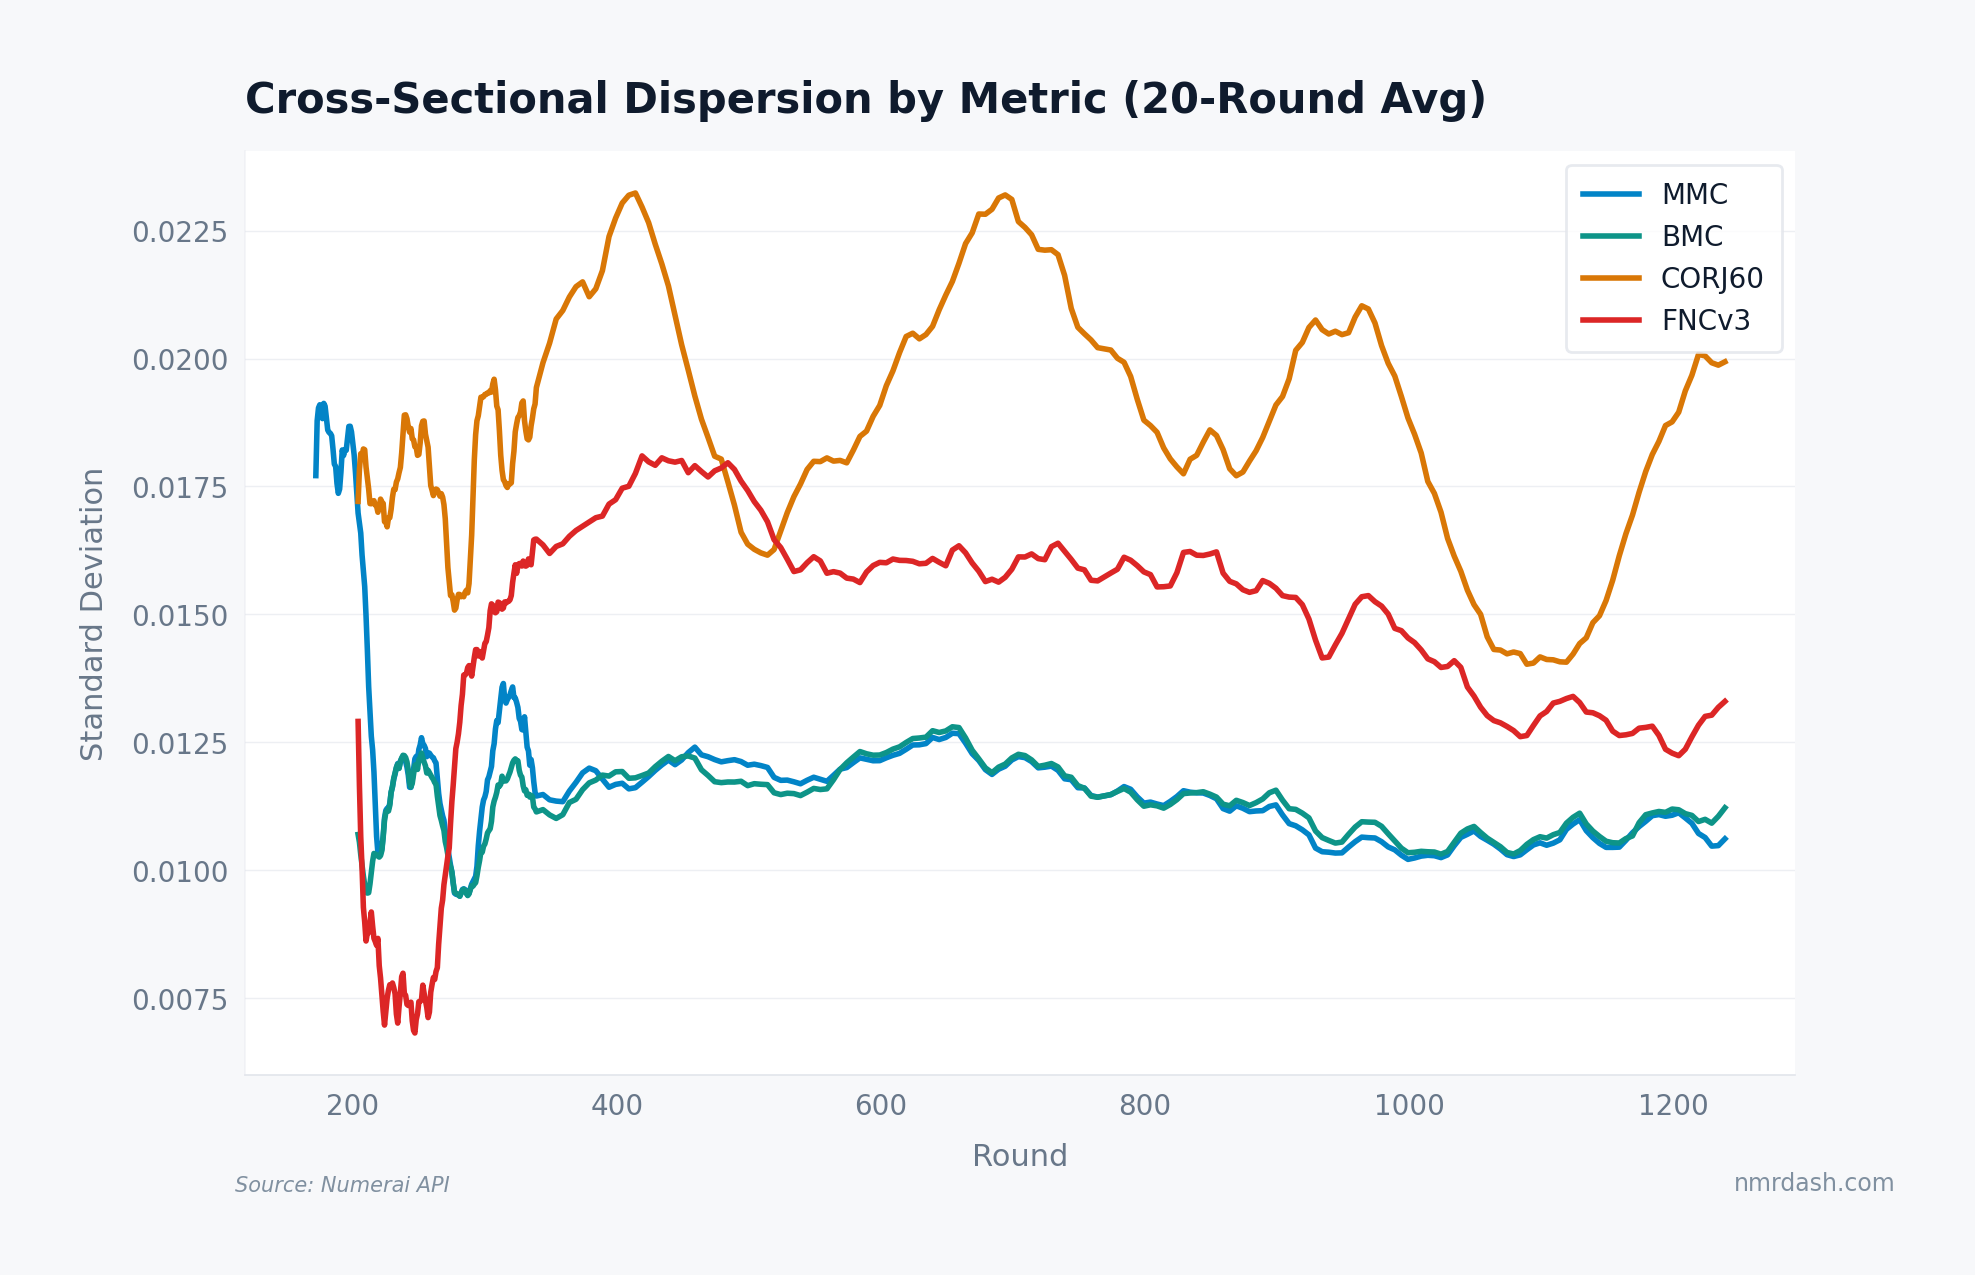
MMC dispersion dropped from roughly 0.019 near round 200 to 0.0105 in recent rounds (a 45% compression), and BMC tracks it almost point for point. FNCv3 fell from a plateau near 0.018 around round 450 to about 0.013. CORJ60 is the exception: its dispersion cycles between 0.014 and 0.023 with market regime and sits near 0.020 today, showing no compression at all. The field is measurably tighter on three of the four primary metrics.
Narrowing dispersion is consistent with a diversification paradox: as more participants enter and learn from the same public resources, feature sets, and target definitions, their predictions regress toward a common signal. New models join the tournament but many arrive with approaches that look like what already exists, pushing dispersion down even as nominal participation grows.
Metric Dominance: Is One Metric Taking Over?
Another convergence test asks, for each model, which metric is its personal best. If the field were collapsing into a single style, one metric's dominance share would grow at the others' expense.
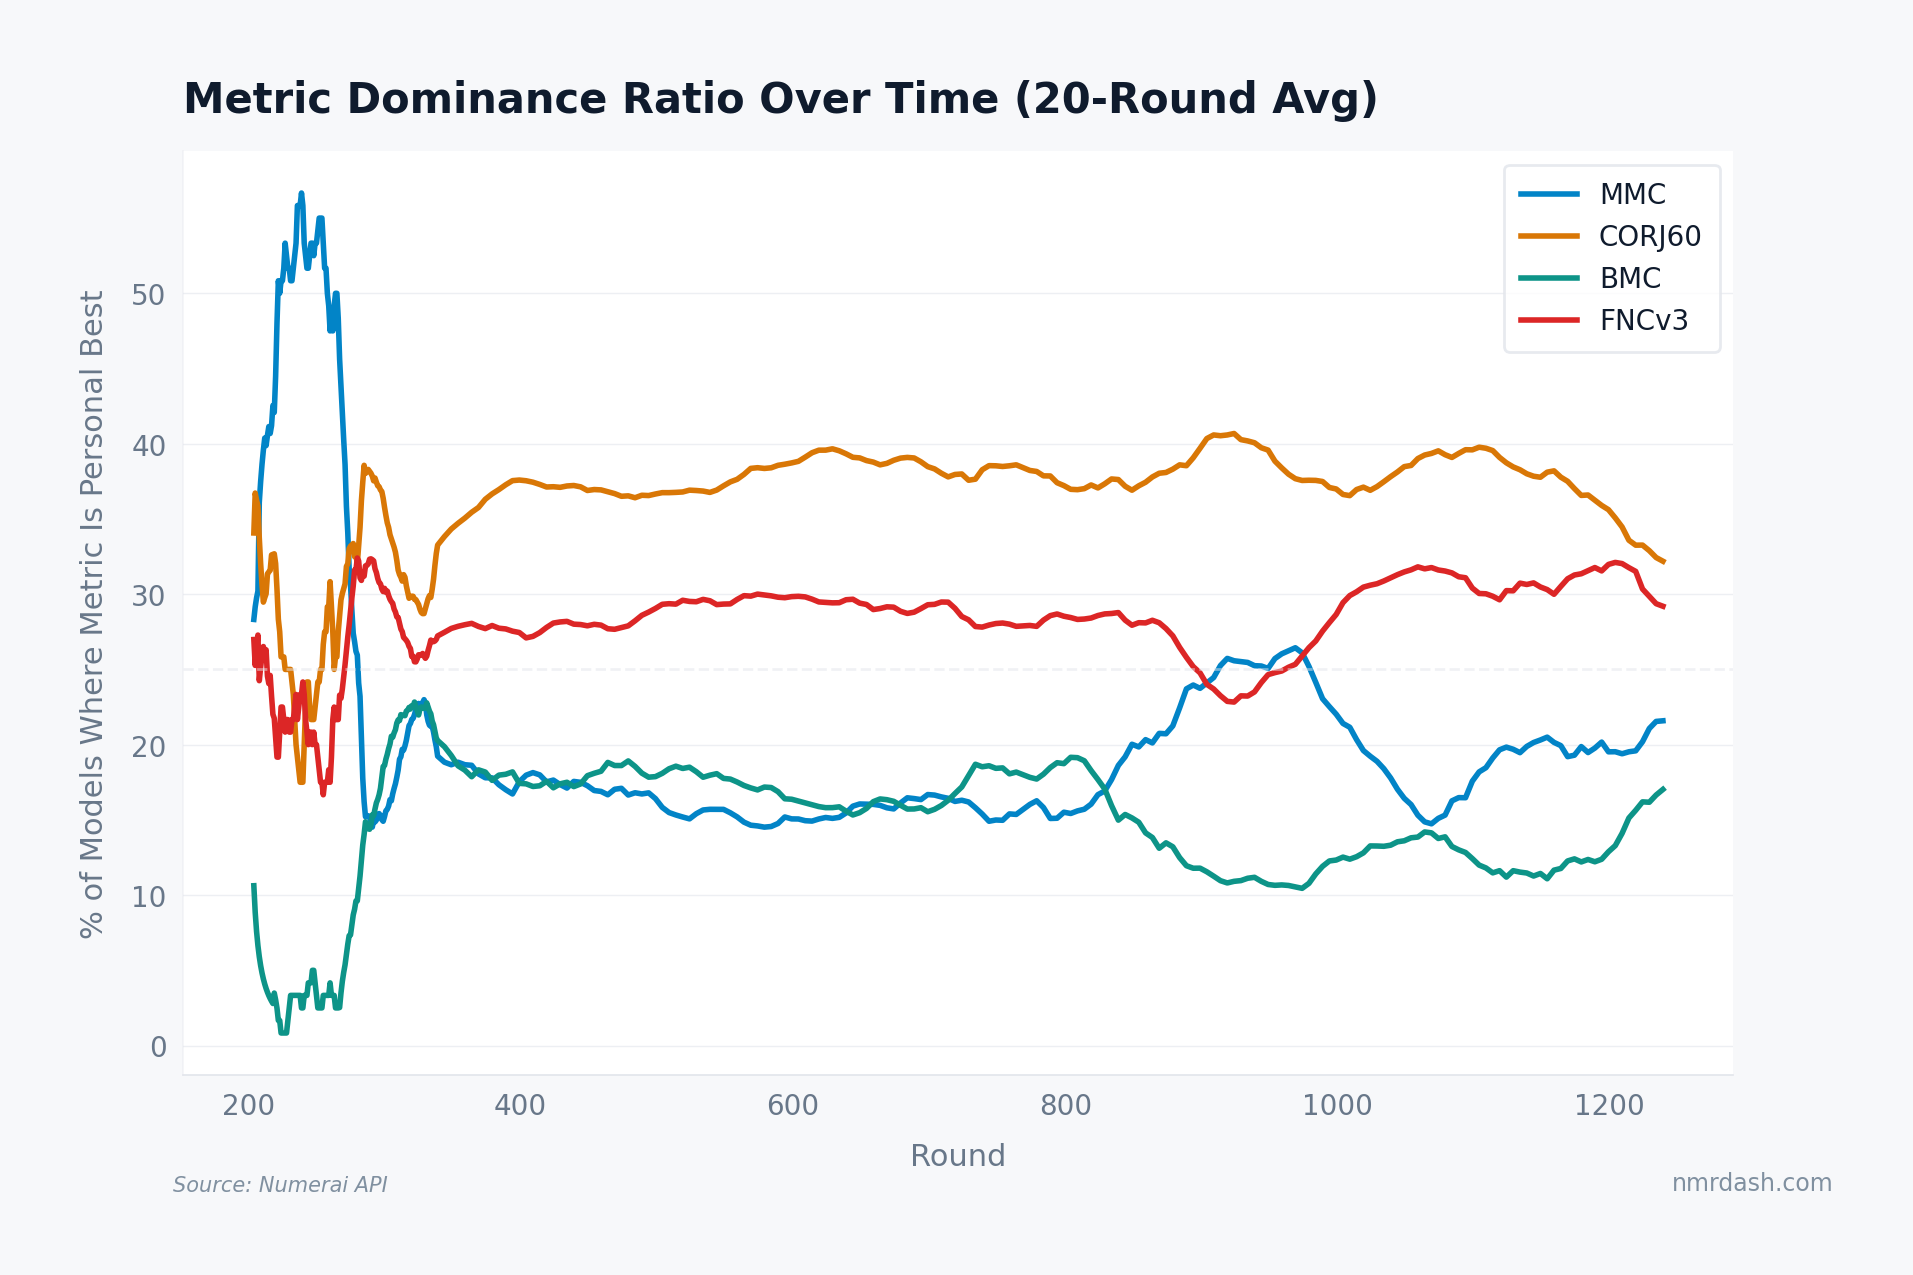
The mix has been remarkably stable. Since round 400, CORJ60 has been the personal-best metric for roughly 35-40% of models, FNCv3 for 26-32%, MMC for 15-26%, and BMC for 10-19%. MMC's share briefly surged toward 26% around rounds 900-950 before falling back. No single metric is absorbing the field: models still win on different axes, even as the axes themselves grow more correlated.
Metric Agreement: The Monoculture Test
The sharpest monoculture signal is sign agreement: what percentage of models have all four primary metrics pointing the same direction (all positive or all negative) in a given round? In a diverse tournament, metrics should frequently disagree for individual models.
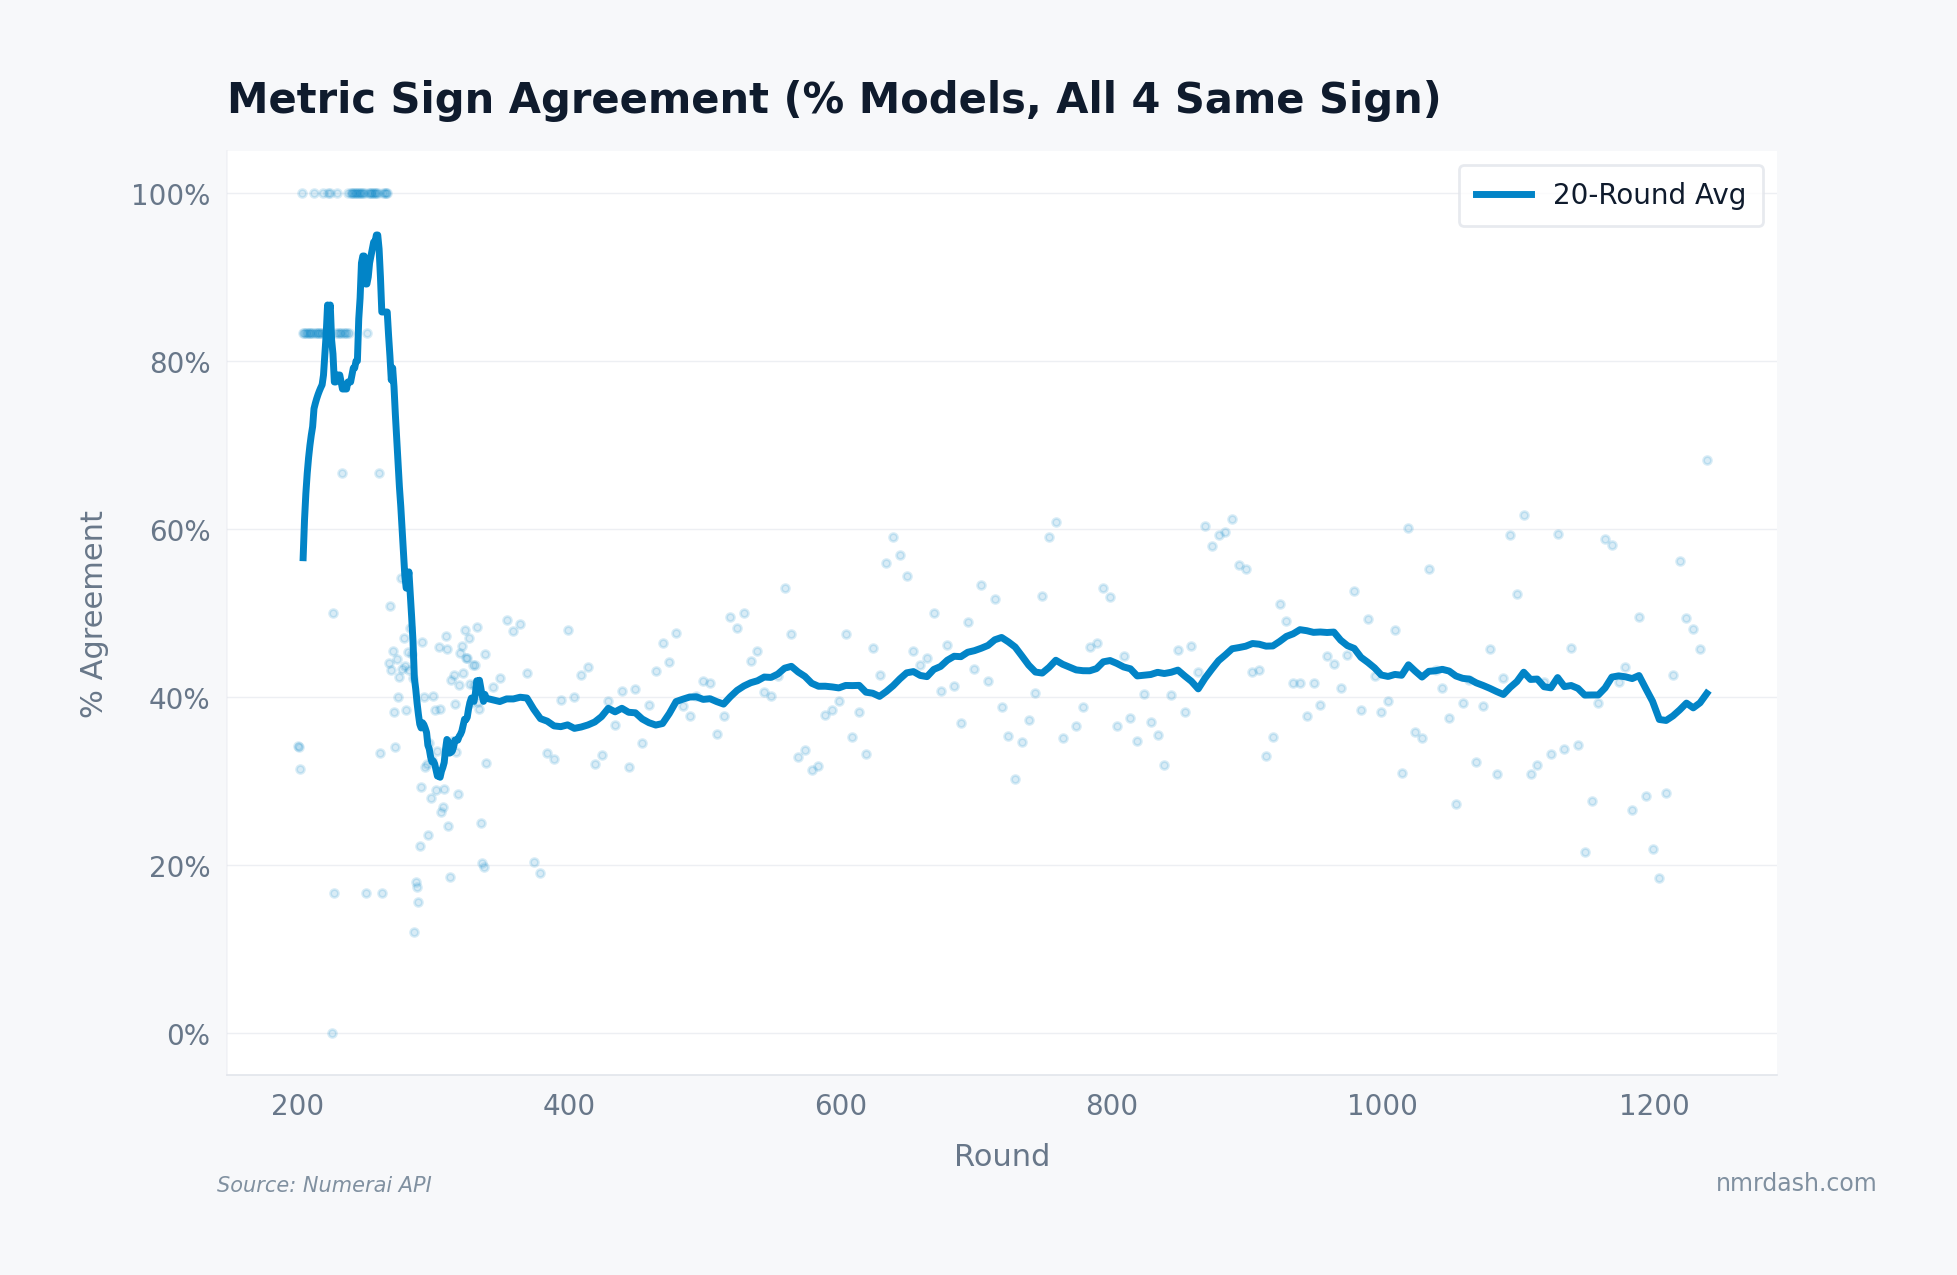
Sign agreement tells a quieter story. After the noisy early rounds (a tiny field where the 20-round average swung between 80% and 100%), agreement collapsed to about 31% near round 300 and has ranged between 37% and 48% ever since. The average sits near 40% today, almost exactly where it was 900 rounds ago.
That flatness matters. If the field were a true monoculture, all four metrics would increasingly rise and fall together for individual models, and this line would climb. It has not, despite the shared knowledge, converging feature pipelines, and gravitational pull of public notebooks and benchmark approaches.
Takeaways
MMC and BMC have effectively merged. Their rolling correlation has held between 0.95 and 0.99 since round 550. Two of the four primary metrics now rank the field almost identically, and MMC-CORJ60 has turned upward again over the last 250 rounds after a long decline.
Dispersion is compressing on three of four metrics. MMC spread fell roughly 45%, with BMC and FNCv3 close behind. CORJ60 is the holdout: its dispersion cycles with market regime rather than trending down.
No single metric is taking over. The share of models whose personal-best metric is CORJ60, FNCv3, MMC, or BMC has been stable since round 400. Models still win on different axes.
Sign agreement is flat near 40%. The sharpest monoculture test comes back negative: the share of models with all four metrics pointing the same way is where it was 900 rounds ago. The evidence for convergence is real but partial: the metrics are collapsing into each other faster than the models are collapsing into each other. Track these trends on the Trends page and per-round detail in Rounds.