Scoring Version Roulette: When Numerai Changes the Rules
Consecutive Numerai MMC versions reshuffle models: 37.5% of observations shift more than 15 percentile points and only 2% look robust across versions.
Numerai has iterated through six versions of MMC scoring, multiple CORJ60 revisions, and several FNC variants. Only 2% of models maintain their percentile rank across versions tightly enough to be called formula-agnostic; 37.5% of model-rounds swing more than 15 percentile points when the formula changes. The same model, the same submission, the same round can rank top quartile under one version and middle of the pack under the next.
The submission_scores table stores all versions simultaneously, making direct comparison possible. This post quantifies disruption across each transition. For context on what these metrics measure, see MMC vs Correlation.
How Disruptive Is Each Version Change?
Take all models scored under two consecutive MMC versions in the same round, rank them by each version, and compute the Spearman rank correlation. A correlation of 1.0 means the version change reordered nobody.
The visible transitions are uneven. v1-to-v2 preserves most rank order at 0.85, v2-to-v3 is much more disruptive at 0.58, and v4-to-v5 recovers to 0.73. The v3-to-v4 slot does not have a comparable visible bar in this chart, so the honest read is not that every transition can be ranked; it is that version changes can range from mild reshuffling to a major reorder.
Who Gets Reshuffled?
The human story is in the percentile shifts: how many models gained or lost 10, 20, or 30 percentile points?
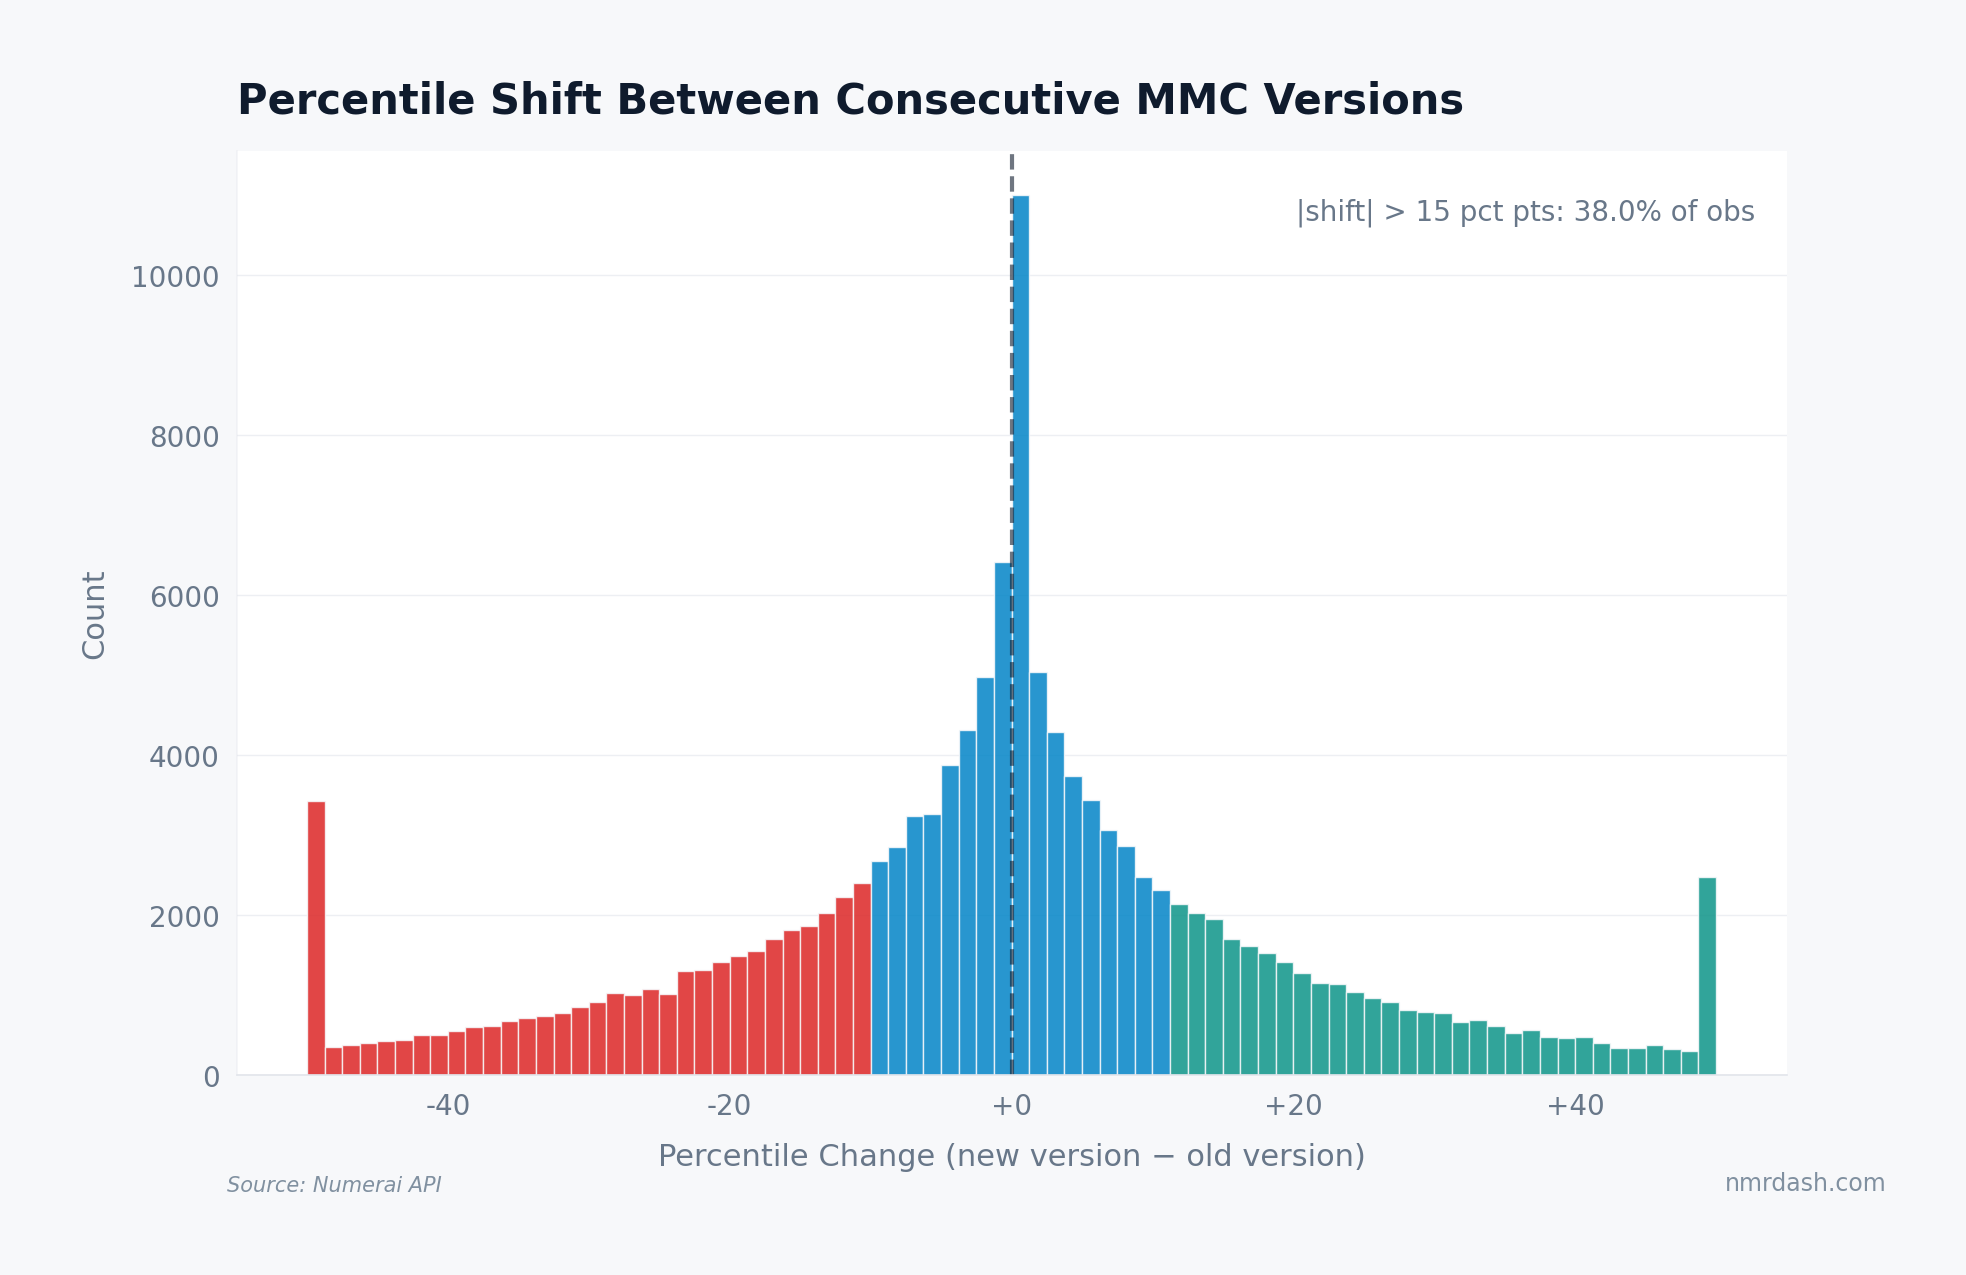
The distribution is roughly symmetric around zero — version changes are not systematically biased toward upgrades or downgrades. But the tails are heavy: 37.5% of observations move by more than 15 percentile points. That is large enough to turn a model that looked safely above average under one formula into a marginal or weak model under another.
Are Any Models Version-Robust?
For each model, we compute the standard deviation of their percentile rank across all available MMC versions within the same round. Low standard deviation means a model performs similarly regardless of which formula applies.
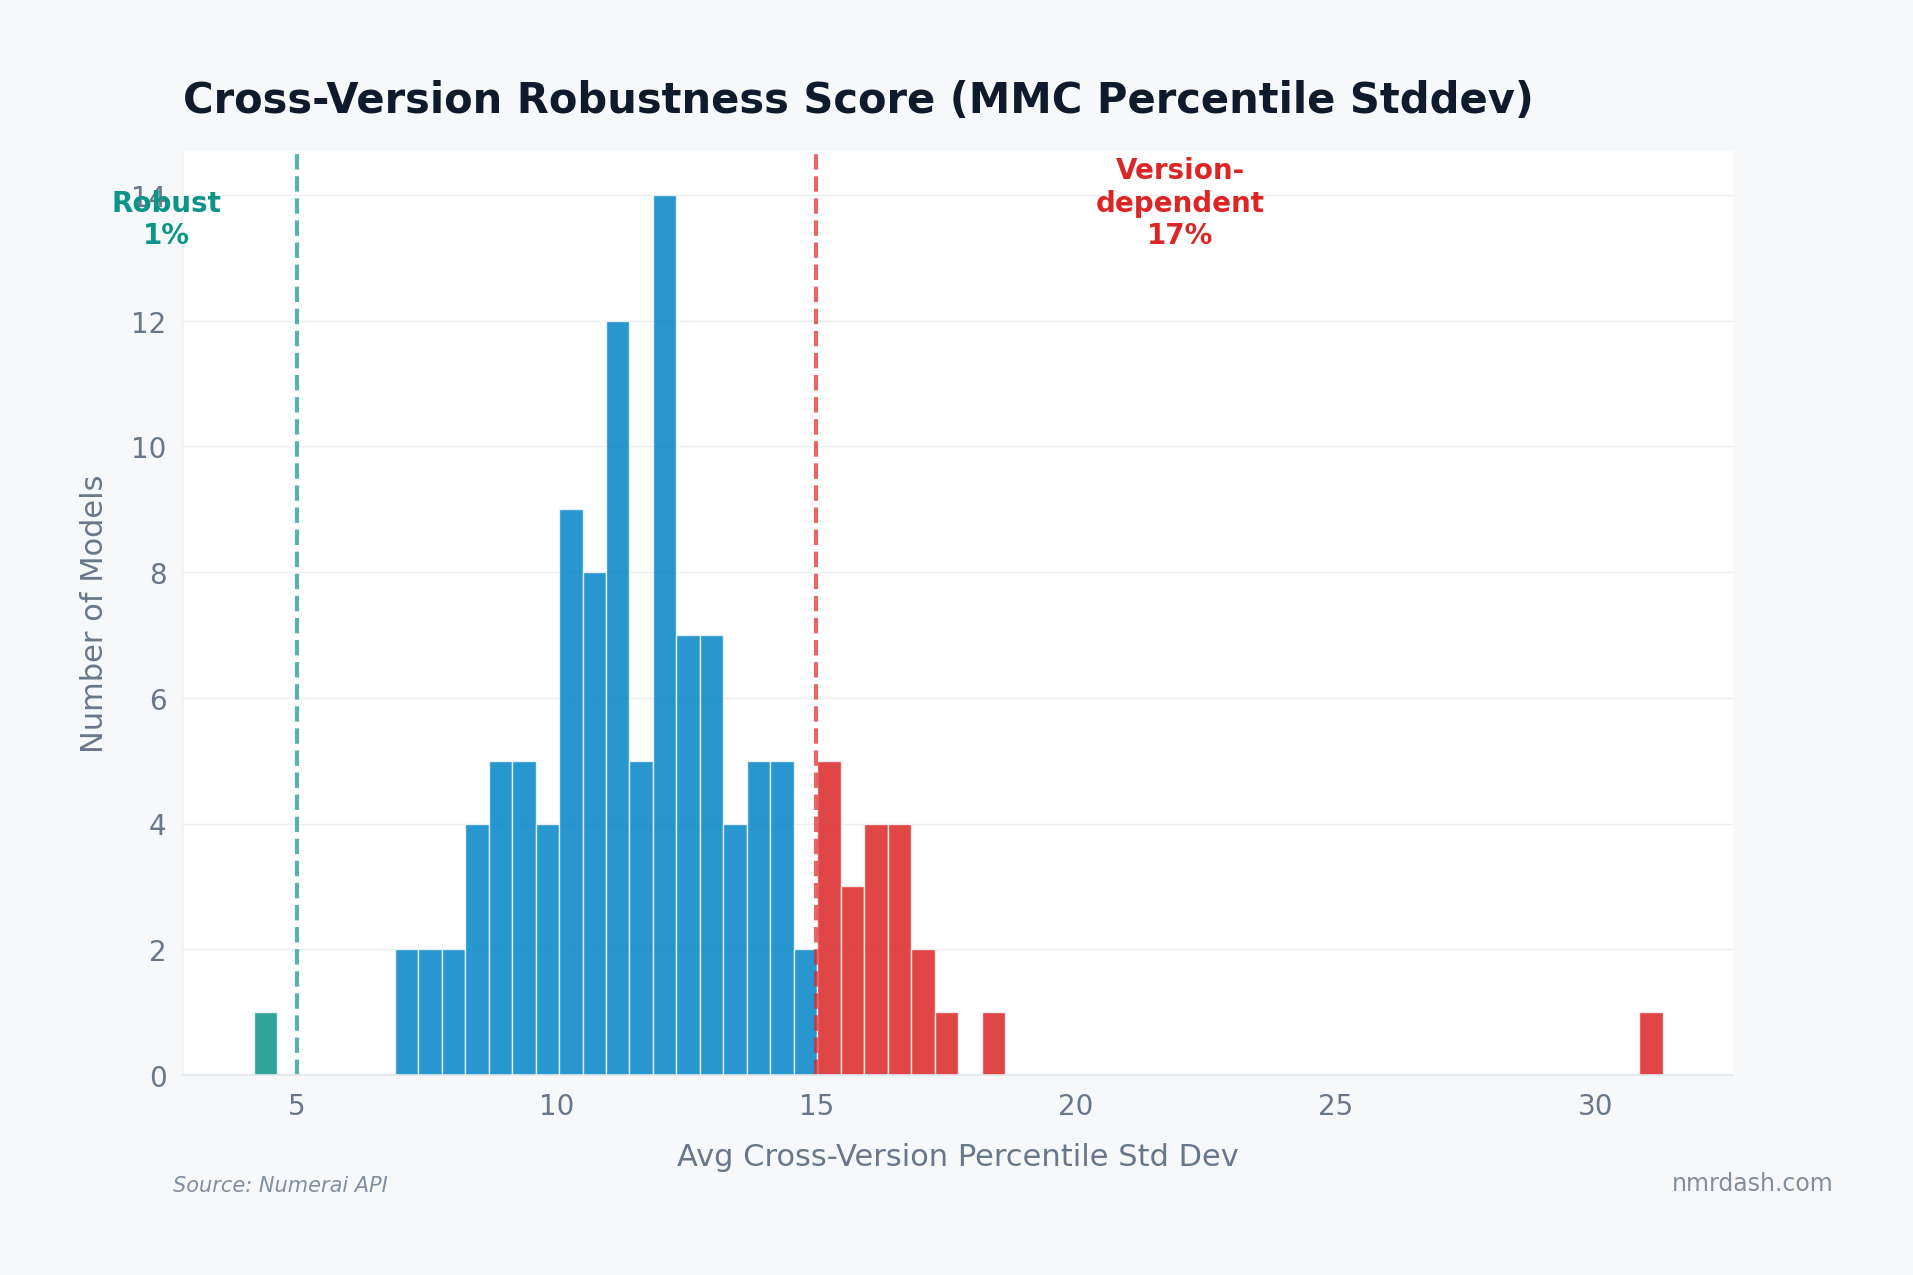
Only about 2% of models qualify as robust under the sub-5-point standard-deviation threshold. These are the rare cases where multiple scoring formulas tell almost the same story.
On the other end, about 17% are version-dependent, with cross-version standard deviation above 15 percentile points. If you are staking on a model, that distinction can matter as much as its current rank: a high placement that depends on one scoring version is a more fragile signal than a model that stays competitive across formulas.
How Wide Is Cross-Version Spread?
Instead of comparing one canonical formula to v1, this chart asks how far the available MMC versions disagree with each other in each round.
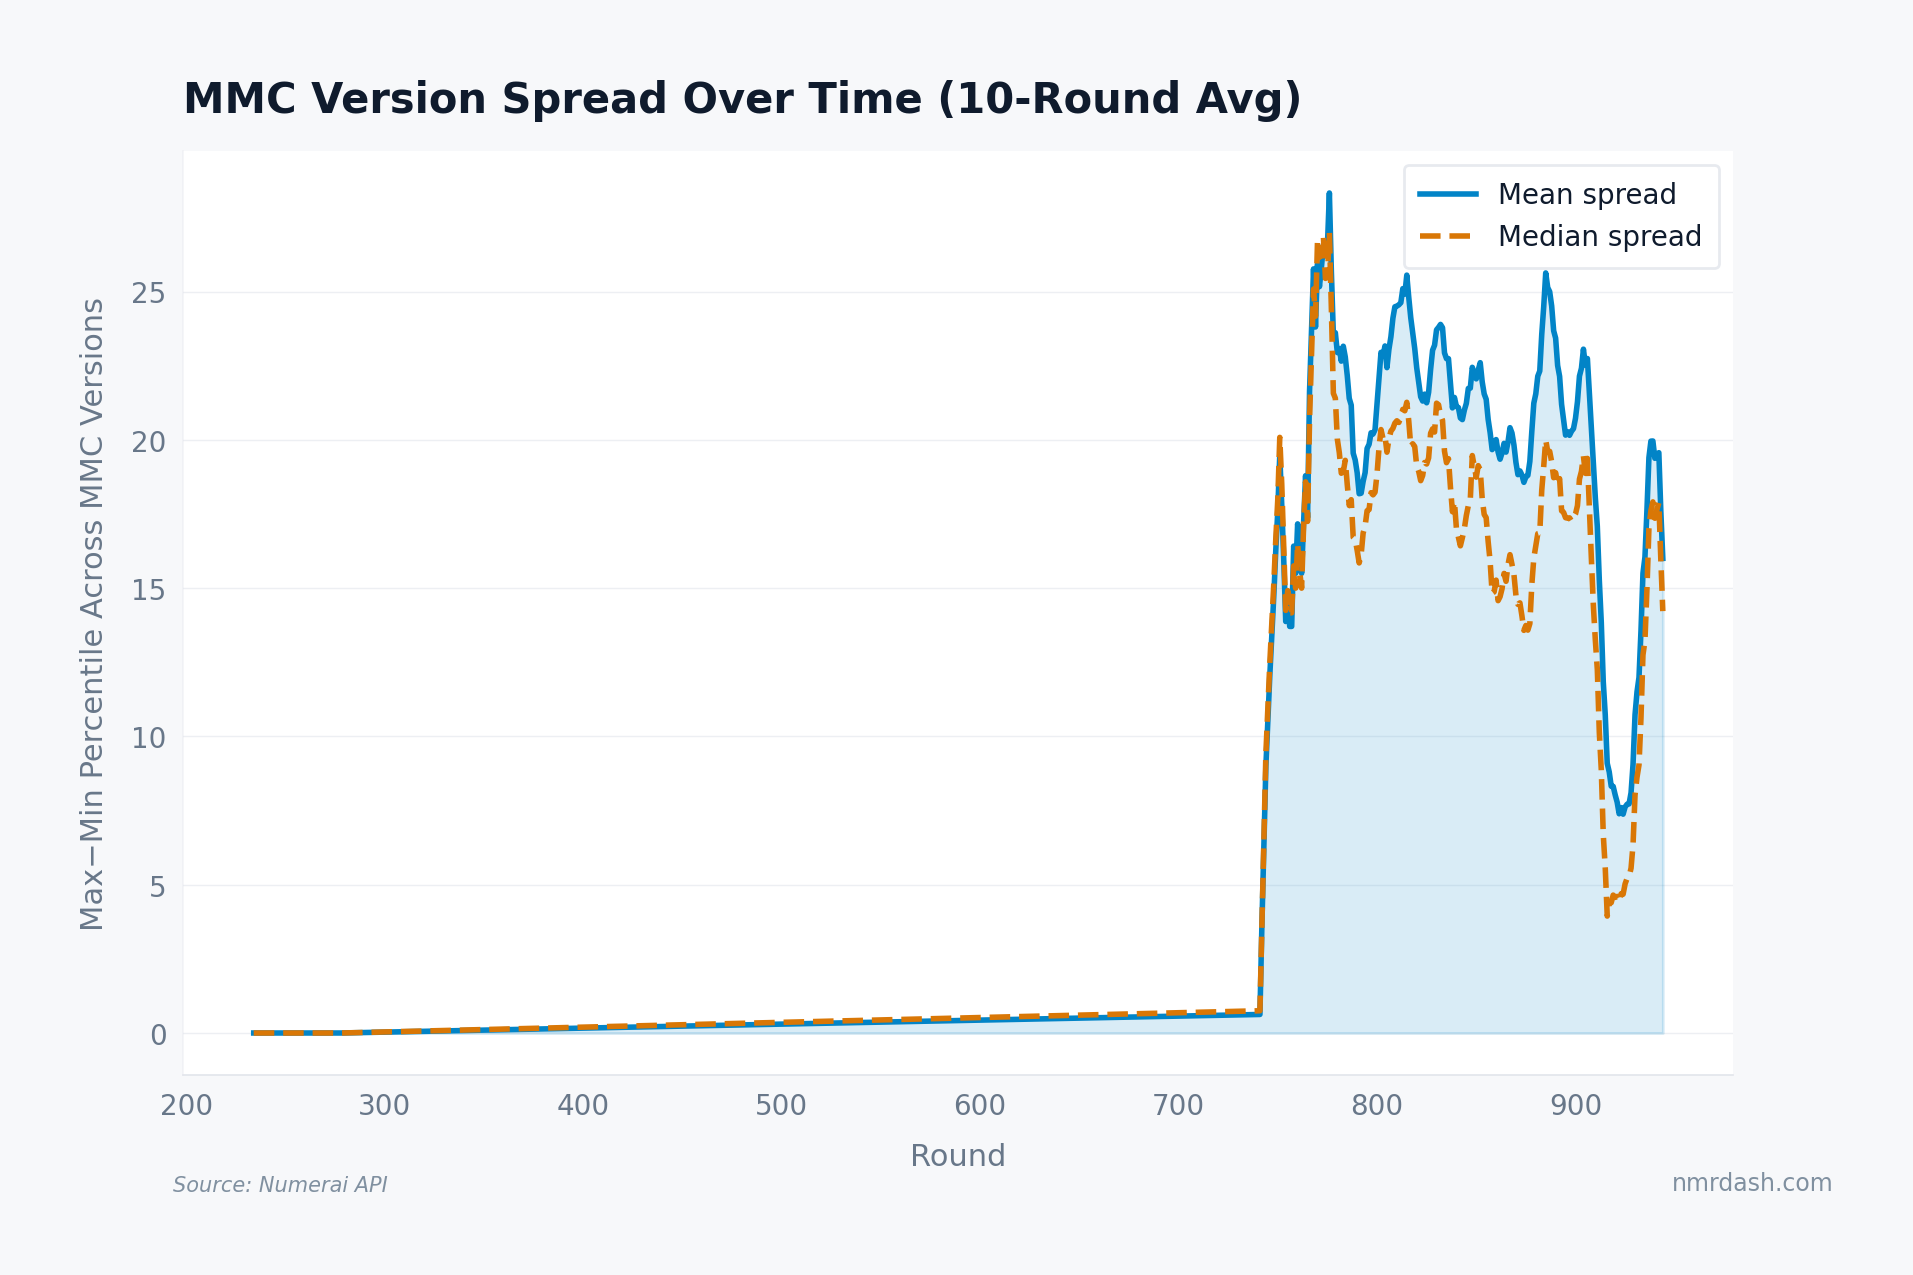
In early rounds, the spread is near zero because there are fewer distinct versions to compare. Once later versions overlap, the average spread jumps into the 15-25 percentile-point range. That is not a tiny implementation detail. It is a reminder that "MMC rank" is partly a statement about which version of MMC you mean.
This is why historical comparisons of "MMC over time" require version awareness — visible in the trends dashboard and explored in the submission score journey.
Takeaways
Not all version changes are equal. The visible consecutive-version correlations range from 0.58 to 0.85, so a scoring update can be a mild adjustment or a major reorder.
Most models are not version-robust. Only 2% maintain a cross-version percentile standard deviation below 5 points, while 17% are clearly version-dependent.
Cross-version spread is large enough to matter. Recent rounds show average spreads in the 15-25 percentile-point range, so version choice can change how a model looks on the rounds list and in medals thresholds.
Robustness is useful but rare. Models that score consistently across versions are less likely to be benefiting from one formula's quirks. Version-dependent models may still be valuable, but they carry a scoring-rule risk worth monitoring alongside the diversification dynamics of your portfolio.