Stake Flows: How NMR Moves Around Burns
Net NMR outflows lead Numerai burn events by 1–2 rounds, large stakers cut ~3% faster than small ones, and 62% of stakes sit unchanged round to round.
Stake is not static. Each week, participants add NMR, withdraw it, or leave their position untouched. Those flows carry information about risk appetite, stress, and how quickly participants react to provisional scores.
This post measures stake flow patterns in the Numerai tournament: whether outflows lead or lag burn events, how stake tiers respond differently, whether NMR volume tracks tournament difficulty, and how passive most stakers really are. For background on staking mechanics, see Is Staking Profitable?. Live data sits on the trends page.
Net Flow vs. Burn Rate
The first question is directional: does capital leave the tournament before burns, or after?
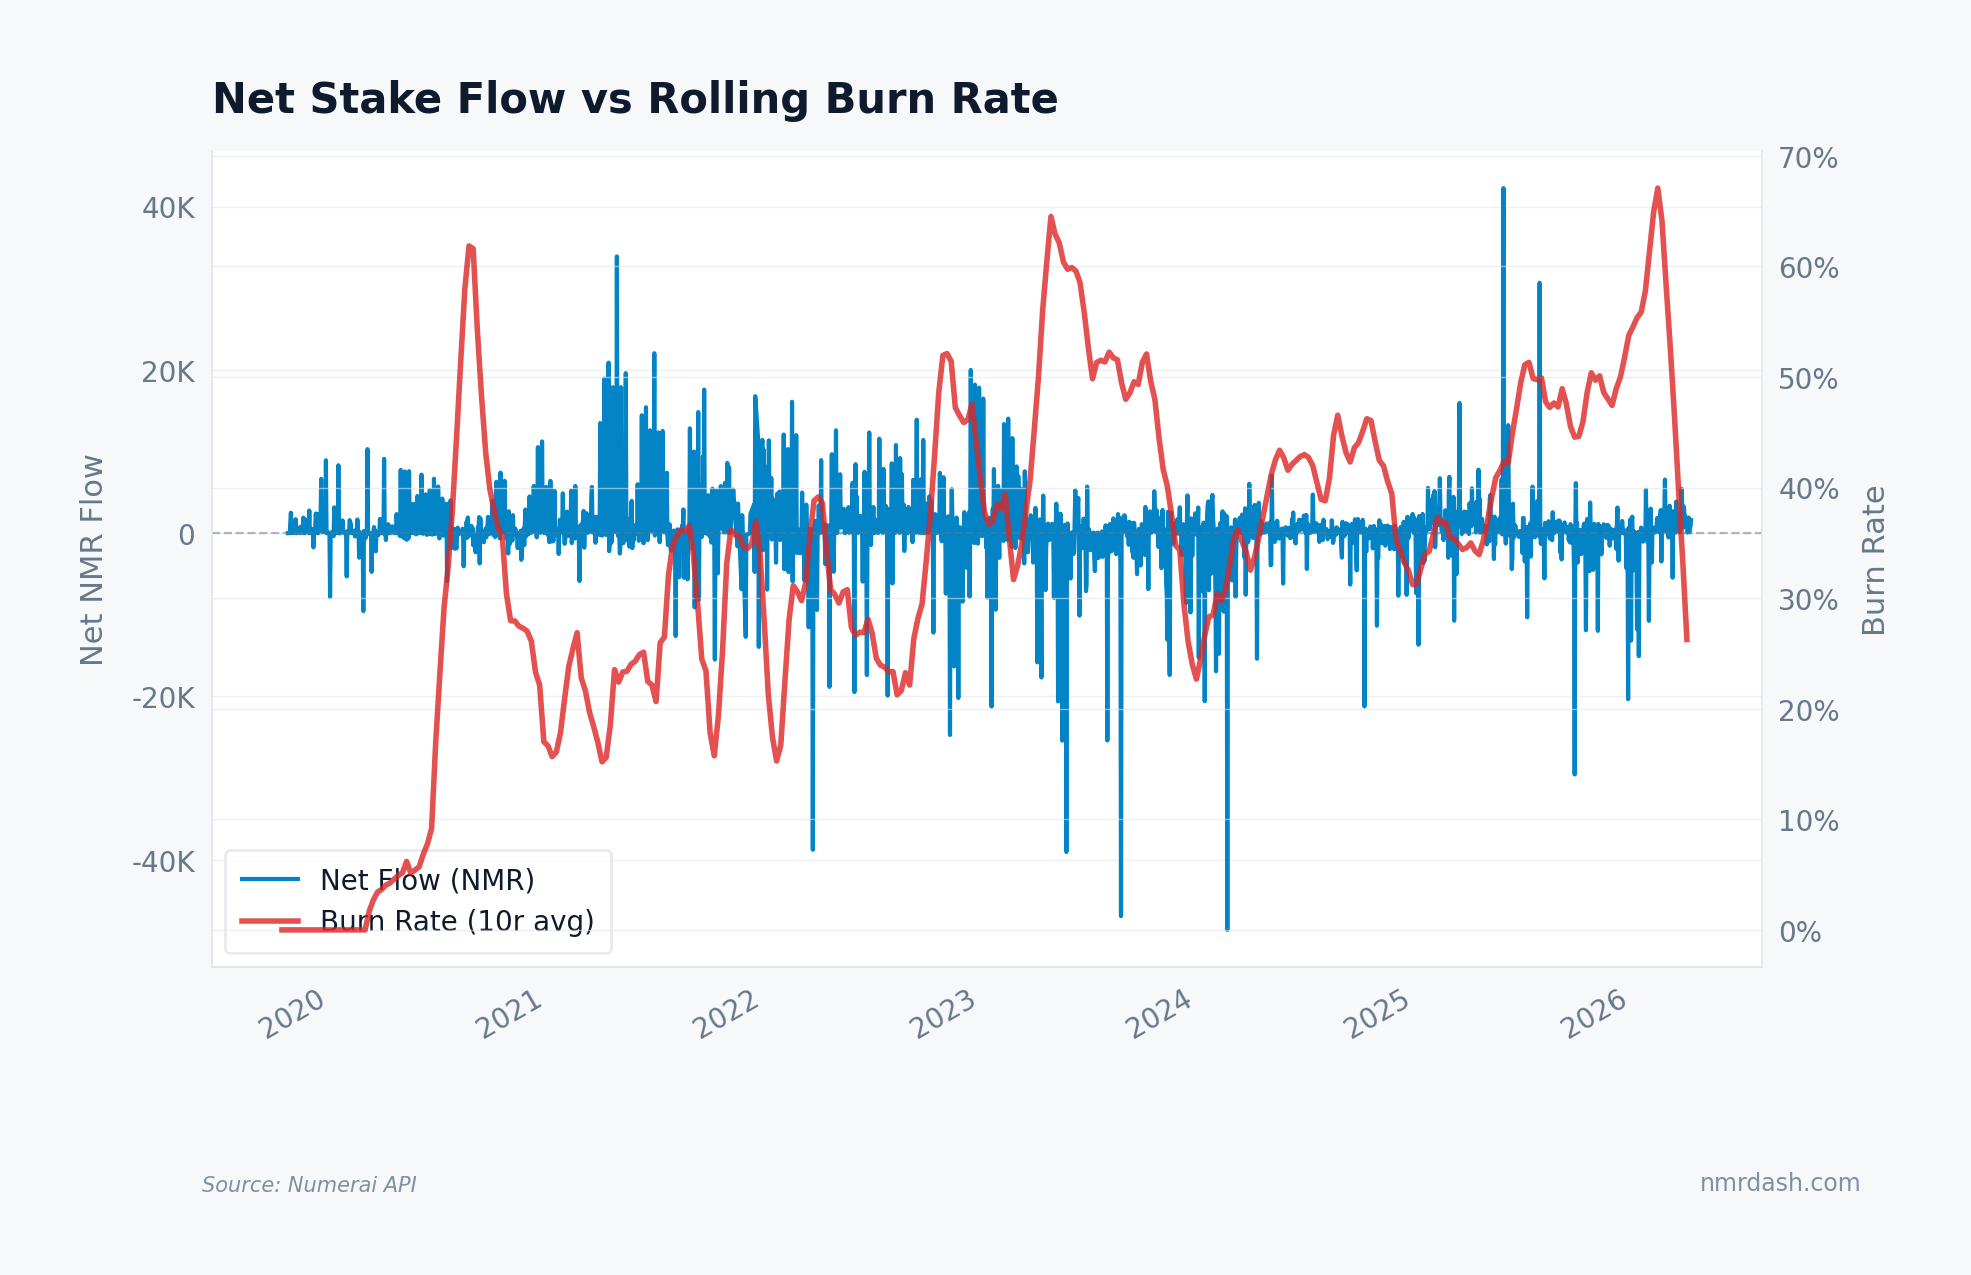
Net flow — the change in total staked NMR — swings between roughly +40K and -50K NMR in extreme rounds. The rolling burn rate (share of staked models with negative payout, 10-round average) tracks a similar rhythm but lags visibly. Outflows precede burn spikes by 1-2 rounds rather than follow them.
That lead is consistent with a subset of participants adjusting on provisional score information before final resolution. It does not require clairvoyance: Numerai scores update through the round, and active stakers can reduce exposure when early marks deteriorate. When net flow turns sharply negative after stability, the next few rounds deserve attention. See Market Regimes for how burn events cluster.
Behavior by Stake Tier
Not all participants respond to stress the same way. Breaking models into stake tiers reveals how size shapes behavior.
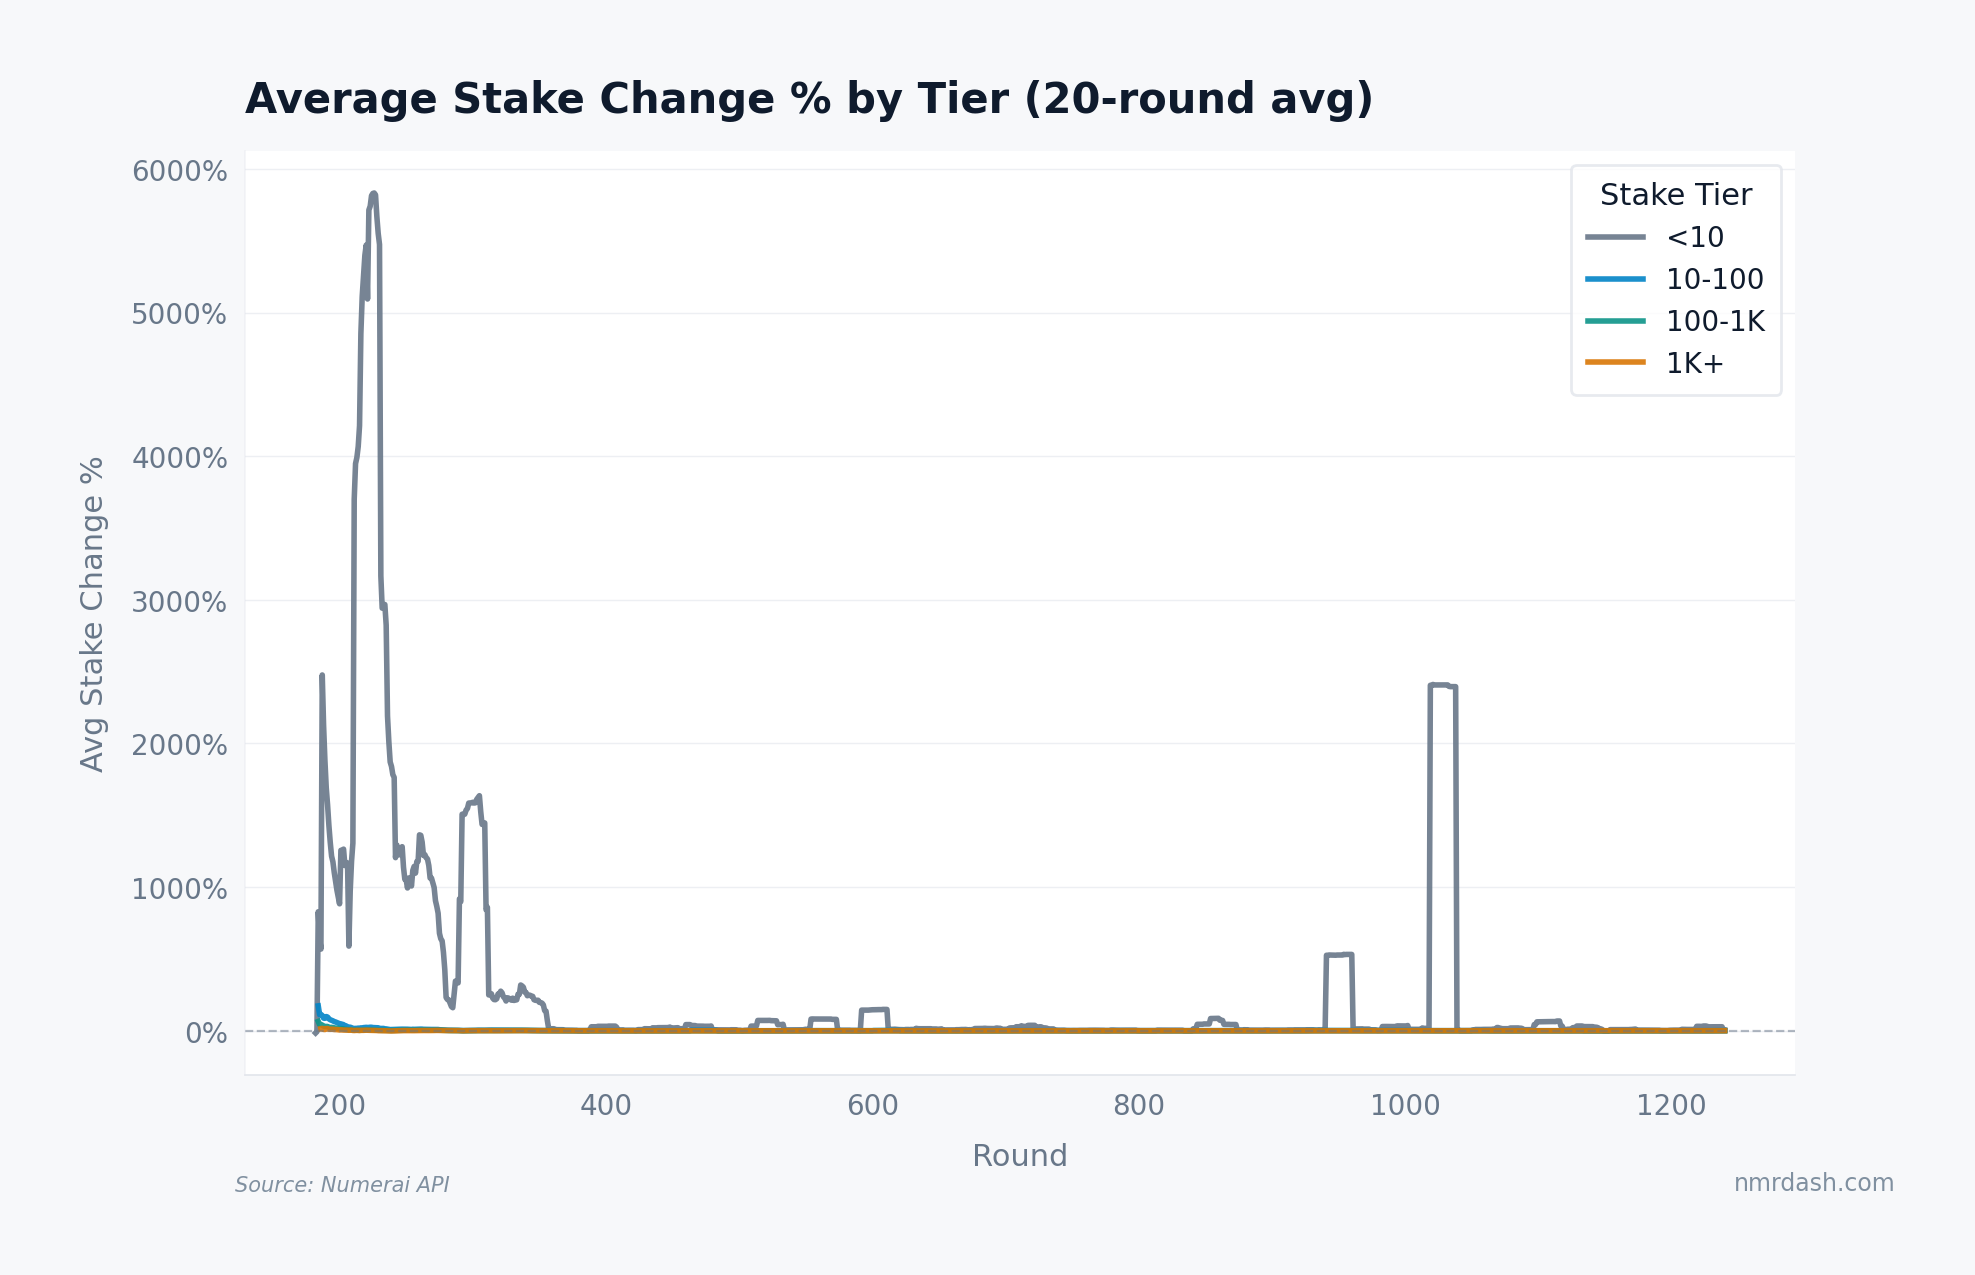
Large stakers (1K+ NMR) reduce their positions roughly 3% faster than sub-10 NMR stakers in the round following a burn event. The 100-1K tier sits in between, and sub-10 stakers are the most inert. Small positions have less capital at risk, and many appear to be left unchanged for long stretches.
The gap narrows during calm periods. When burns are low, all tiers drift upward at similar rates. The divergence opens specifically during stress, consistent with larger stakers managing exposure more actively. This tiered response partly explains the leading outflow signal above: the largest positions can move the aggregate number even when most models do nothing.
For a live breakdown of how stake concentrates among top models, see the stake concentration chart.
NMR Volume vs. Tournament Stress
If tournament burns create sell pressure, that should show up in exchange trading volume.
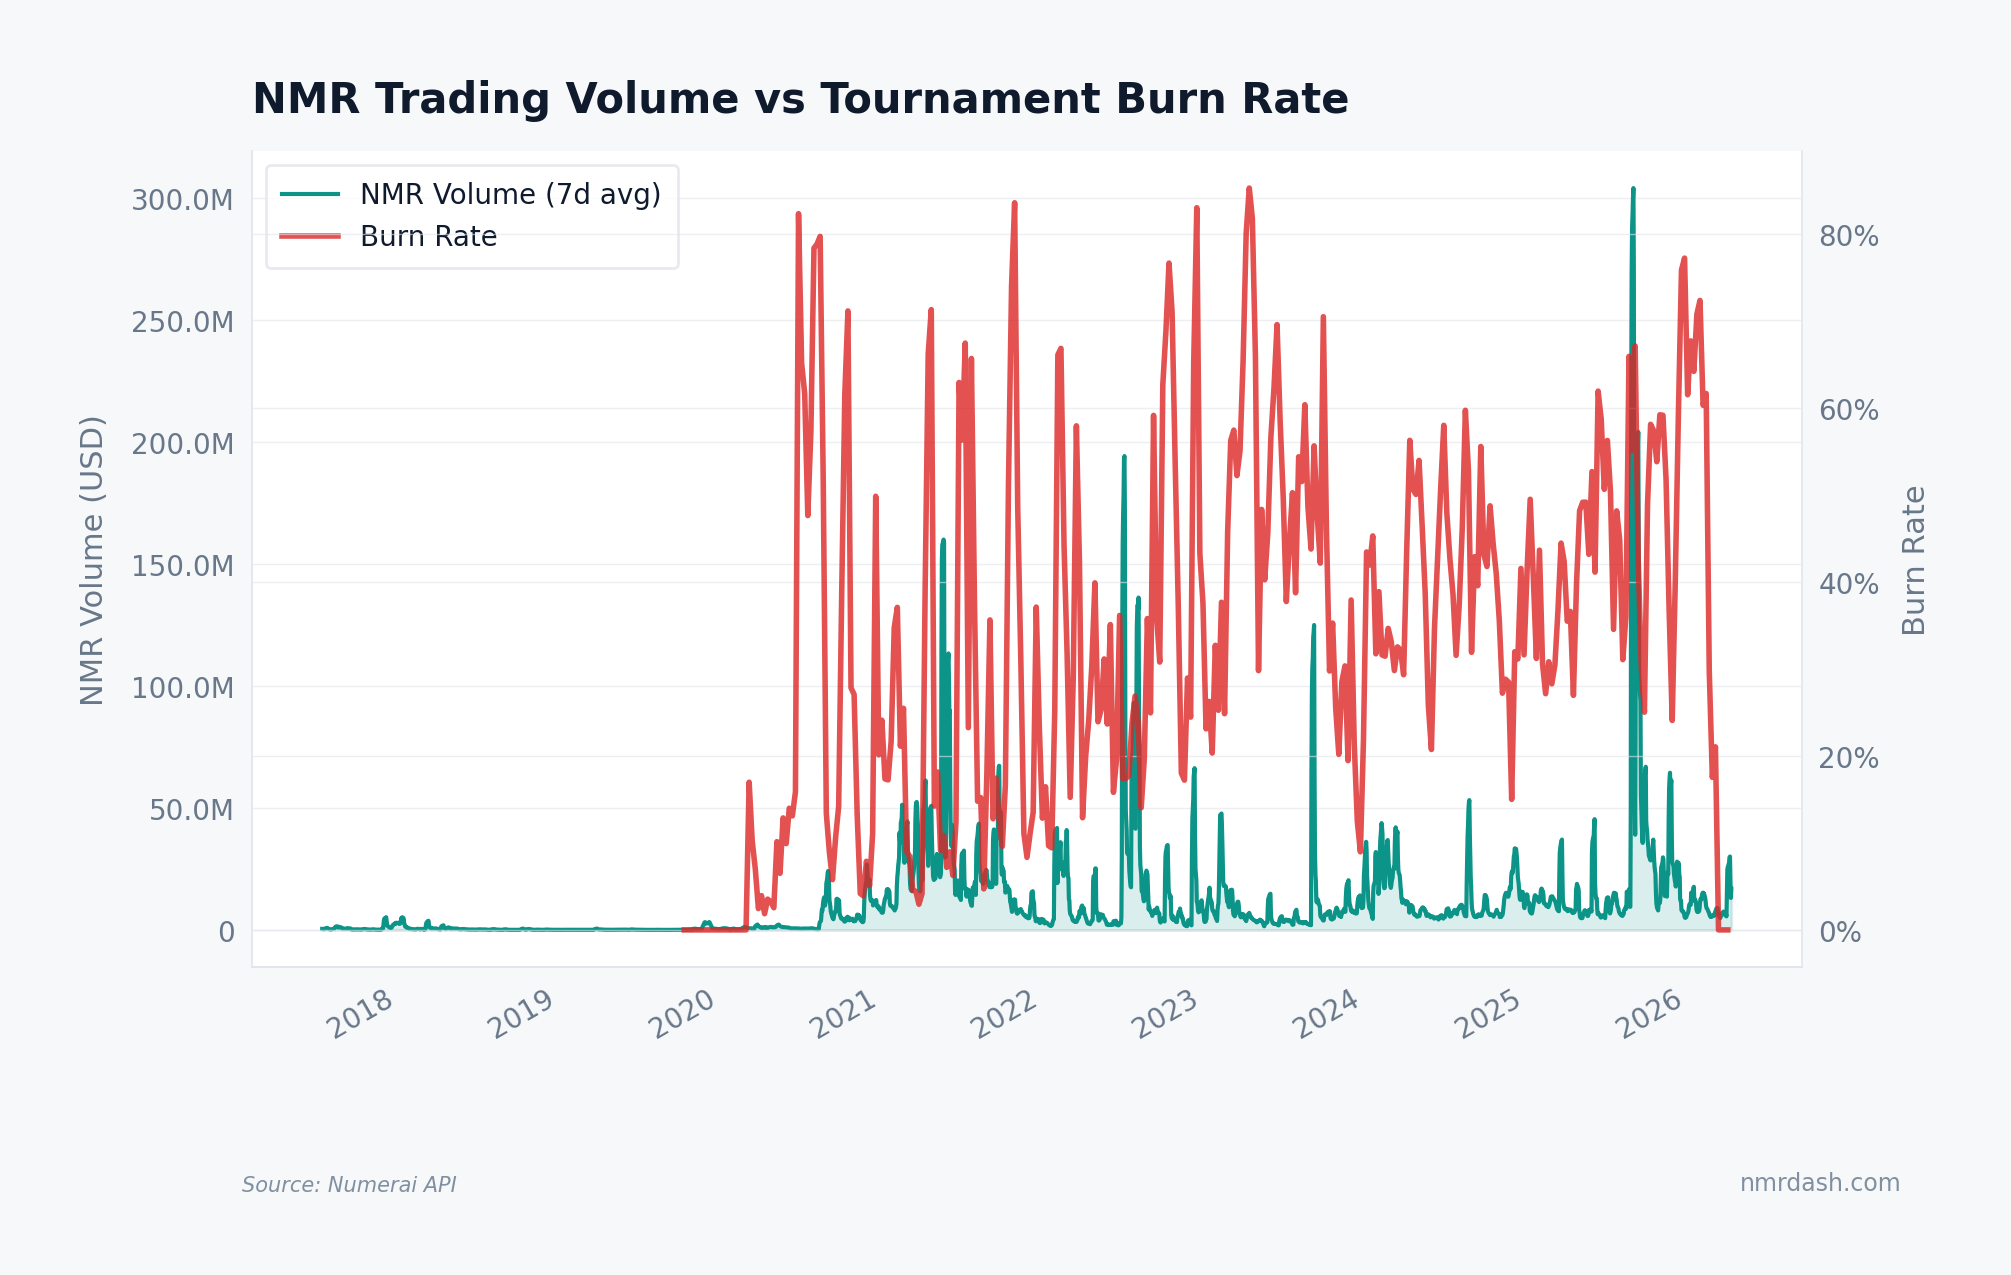
The relationship is noisy. NMR volume rises during high-burn stretches, but also spikes on crypto-wide events unrelated to the tournament. The correlation is positive but modest — enough to say tournament stress can coincide with heavier trading, not enough to isolate selling pressure from broader market moves.
The cleanest signal is in the tails: the five highest-volume weeks all coincide with either a burn spike above 65% or a major crypto move, usually both. For the supply-side view, see NMR Token Economics.
Stake Stickiness
Most stakers do not actively manage their position. "Stake stickiness" measures the share of models with identical selected_stake_value to the prior round.
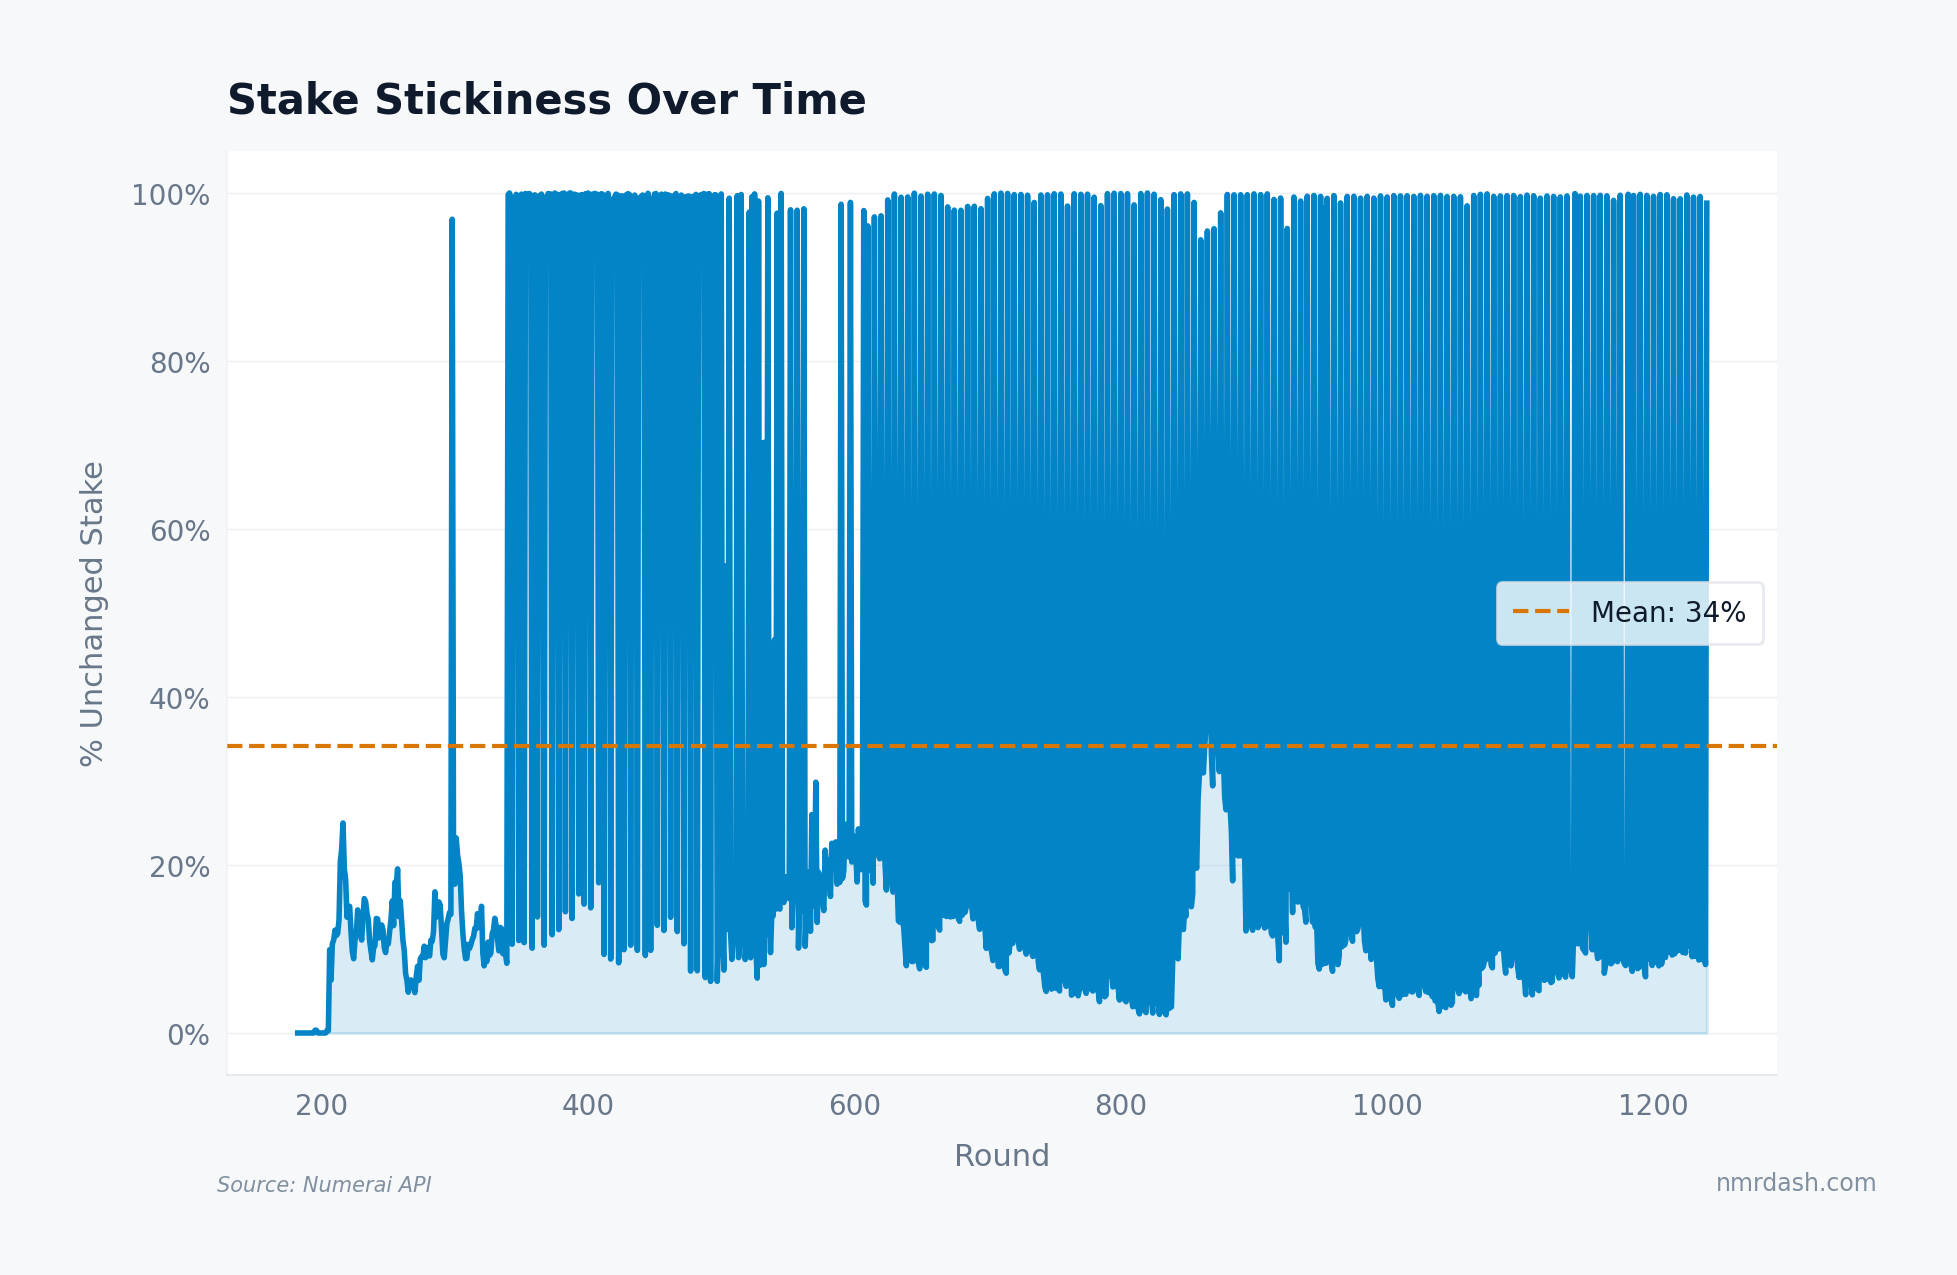
On average, 62% of models carry the exact same stake from one round to the next. In calm stretches stickiness climbs to 75%; during volatile periods it dips to 45%, meaning a majority are adjusting. Those dips align with the stress periods visible in every chart above.
High stickiness stabilizes total stake and makes the meta-model more predictable. But the active minority — the 25-38% who adjust — exerts outsized influence on aggregate flow. When stickiness drops and net flow goes negative simultaneously, that convergence has historically preceded difficult burn clusters.
Takeaways
Net outflows lead burn events by 1-2 rounds. Capital begins leaving before final round resolution, consistent with active participants reacting to provisional scores rather than waiting for settled results.
Large stakers respond faster to stress. The 1K+ tier cuts positions about 3% more aggressively than smaller tiers after burn events. In calm periods, tier behavior converges.
NMR volume loosely tracks tournament stress. High-burn periods coincide with elevated trading volume, but crypto-wide moves dominate the signal. Volume alone is not a reliable tournament indicator.
Most stakes are passive. 62% of positions go unchanged round to round. The active minority drives aggregate flows, and drops in stickiness combined with negative net flow have historically preceded difficult stretches.