Payout Gini: Is Numerai Becoming Winner-Take-All?
Numerai payout inequality rose from a Gini of 0.85 to roughly 0.97 and now tracks stake inequality — concentration is high but no longer rising.
Across the ten most recent resolved Classic rounds, the top 1% of paid models captured a median 64% of all positive payouts. That is the headline: a Gini coefficient of 0.97 is not an abstract economic measure here; it means roughly two dozen models walk away with two-thirds of every round's winnings, while the remaining ~1,700 paid models split the rest. The question is whether the formula creates that gap or just reflects who showed up.
This post computes the payout Gini for every Numerai Classic round, compares it to stake inequality, and tests whether the tournament is becoming winner-take-all. For background on how payouts work, see The Payout Factor. For aggregate NMR flows, see Round Economics.
Payout Inequality Over Time
For each round, take all models with nonzero payouts (positive or negative), compute the Gini coefficient of absolute payouts, and plot it over time.
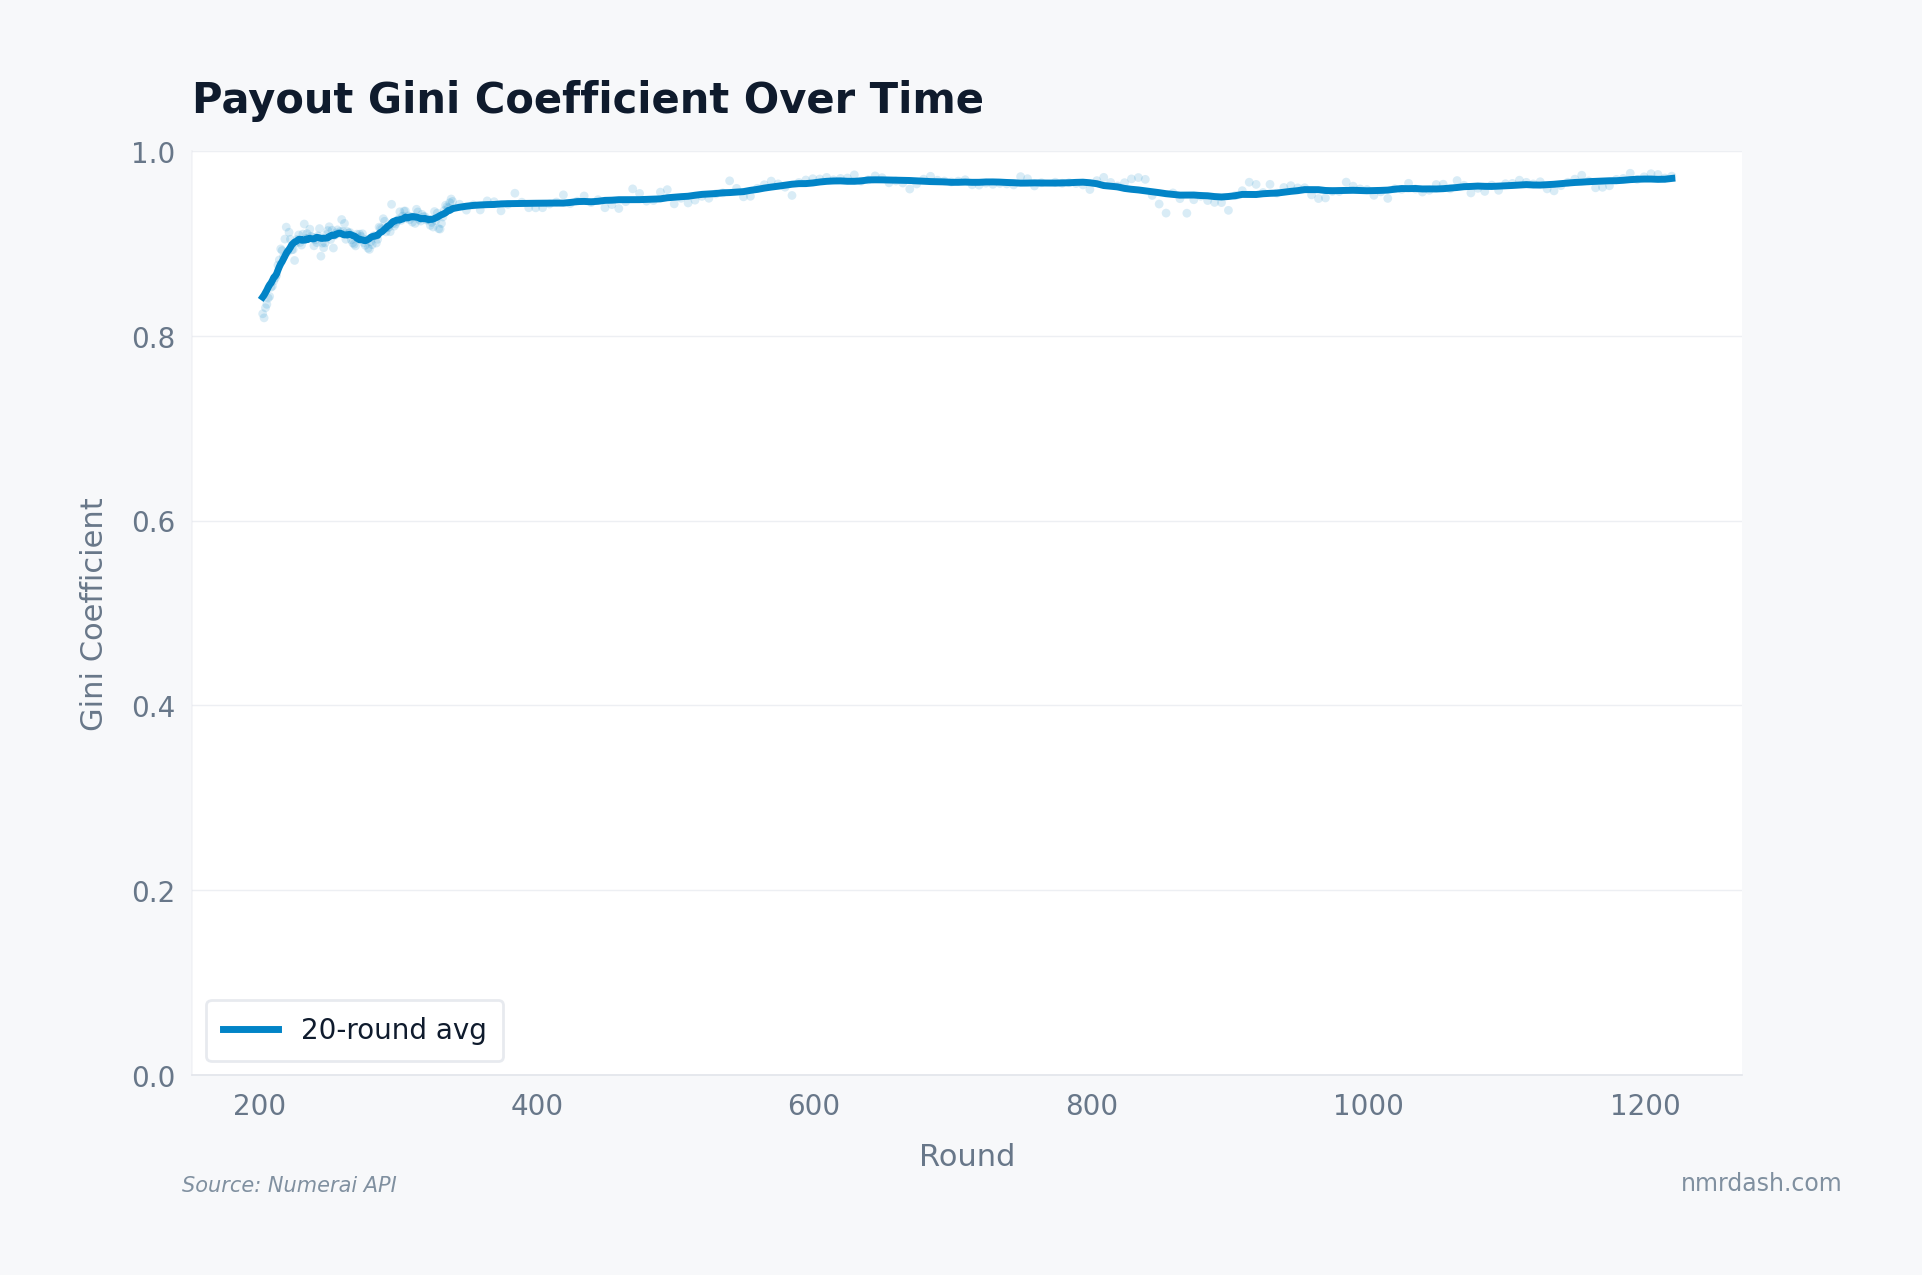
The payout Gini started near 0.85 around round 200, climbed steadily through round 600, and has sat in a tight 0.95–0.97 band ever since. That is extremely high: a small number of models account for most absolute payout movement. The trajectory matters too, though. The Gini stopped rising around round 600 and has been roughly flat for over 600 rounds.
The initial climb from 0.85 to 0.95 coincides with a surge in participation and stake concentration. More models entering at small stakes mechanically pushes the Gini upward even if the payout formula is neutral. The plateau suggests an equilibrium: stake distribution stabilized, and payout distribution followed.
Does the System Amplify Concentration?
The key question: does payout inequality exceed stake inequality? If the payout Gini sits consistently above the stake Gini, the tournament formula amplifies concentration. If it tracks below, the formula dampens it.
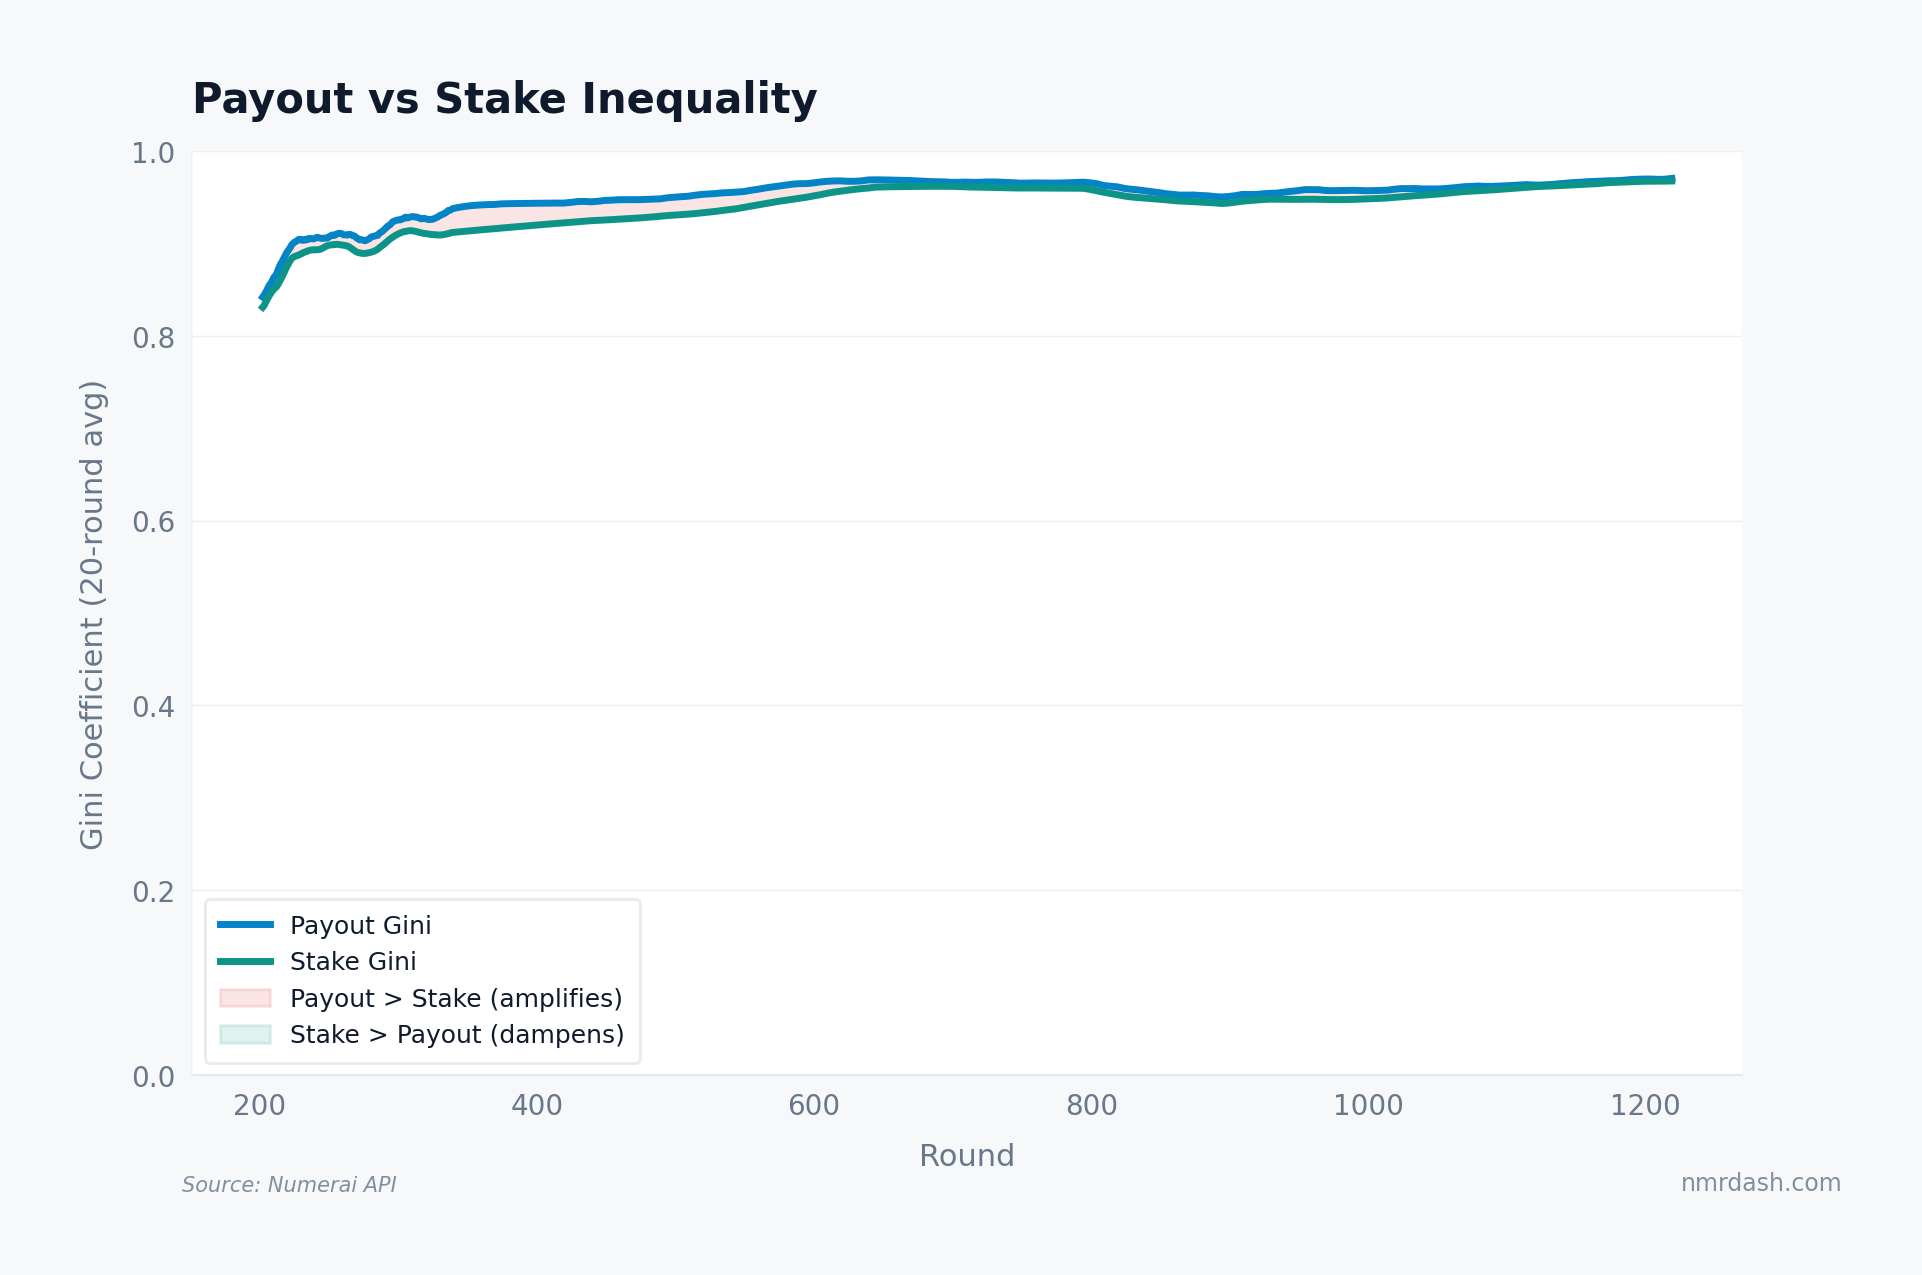
The two lines track each other closely. Payout Gini sits slightly above stake Gini across most rounds. The red-shaded region shows where the system amplifies concentration; the gap is narrow, typically 1–3 percentage points. Stake inequality explains most of payout inequality.
This fits the mechanics. Payout equals stake times score times the payout factor. If scores are roughly similar across models, as metric convergence suggests, then payout inequality mirrors stake inequality with small amplification from score variance. This chart does not prove large stakers earn higher percentage returns; it shows they receive more absolute NMR because they put more NMR at risk. The percentage-return question is better handled by the payout ROI by stake tier analysis.
Who Captures the Payouts?
Breaking positive payouts into cohorts shows where NMR actually flows.
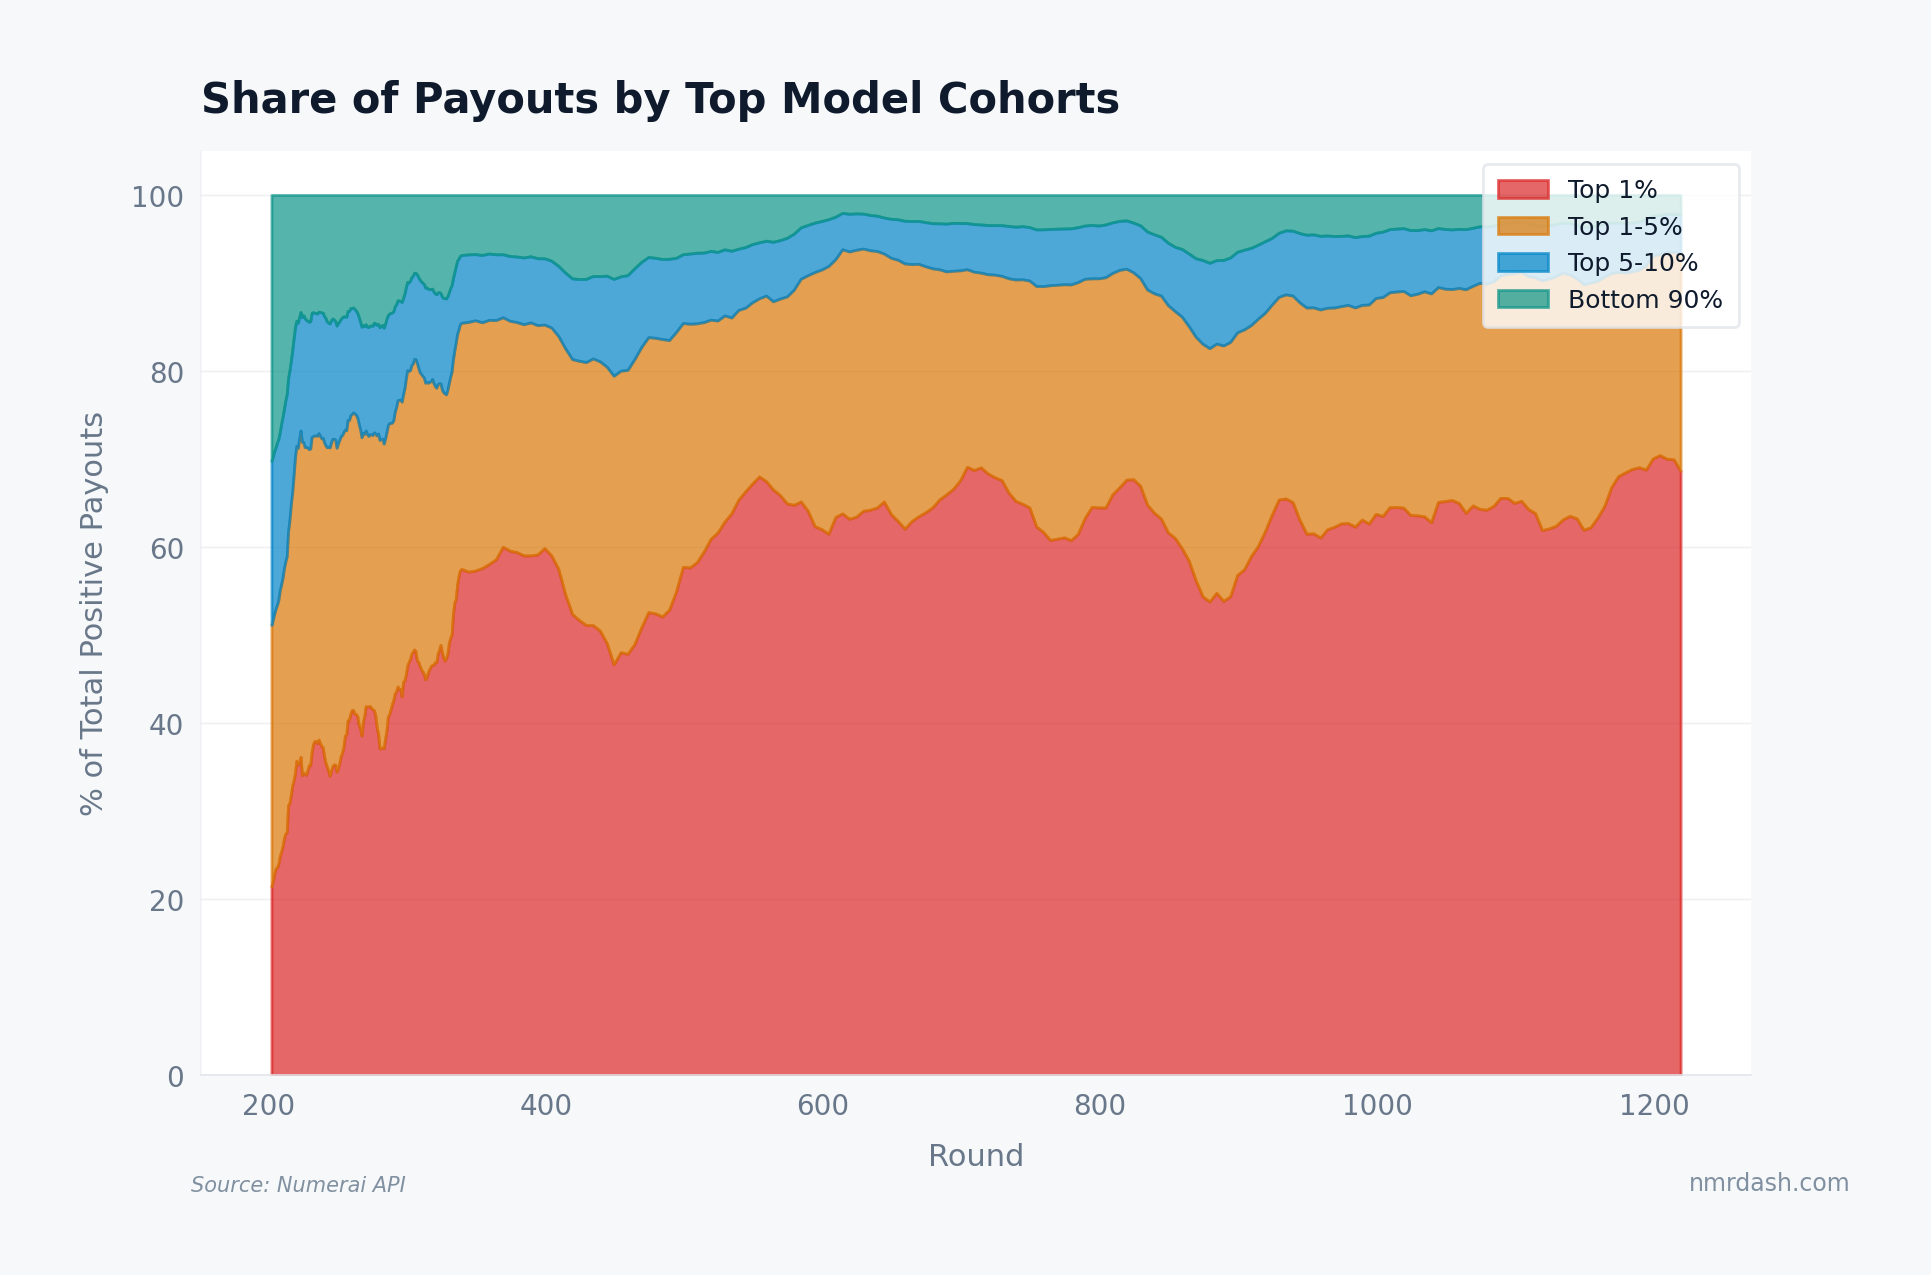
Recent rounds are much more concentrated than a casual "top 10%" framing suggests. In the ten most recent resolved rounds the top 1% of paid models captured between 53% and 71% of all positive payouts, with a median of 64%. The next cohorts split a much smaller remainder. The bottom 90% still contains many paid models, but in absolute NMR terms it is not where most positive payout flows.
The top-1% share has held high since the mid-tournament era. Earlier rounds show more volatility because fewer models participated, so one high earner could swing the percentage. As hundreds more models entered, cohort shares smoothed out, but they did not become egalitarian. The pattern matches the stake concentration data: a small top cohort holds enough stake that it also absorbs most absolute positive payout.
Lorenz Curves Across Three Eras
A Lorenz curve plots cumulative payout share against cumulative model share. The further a curve bows from the 45-degree equality line, the more unequal the distribution.
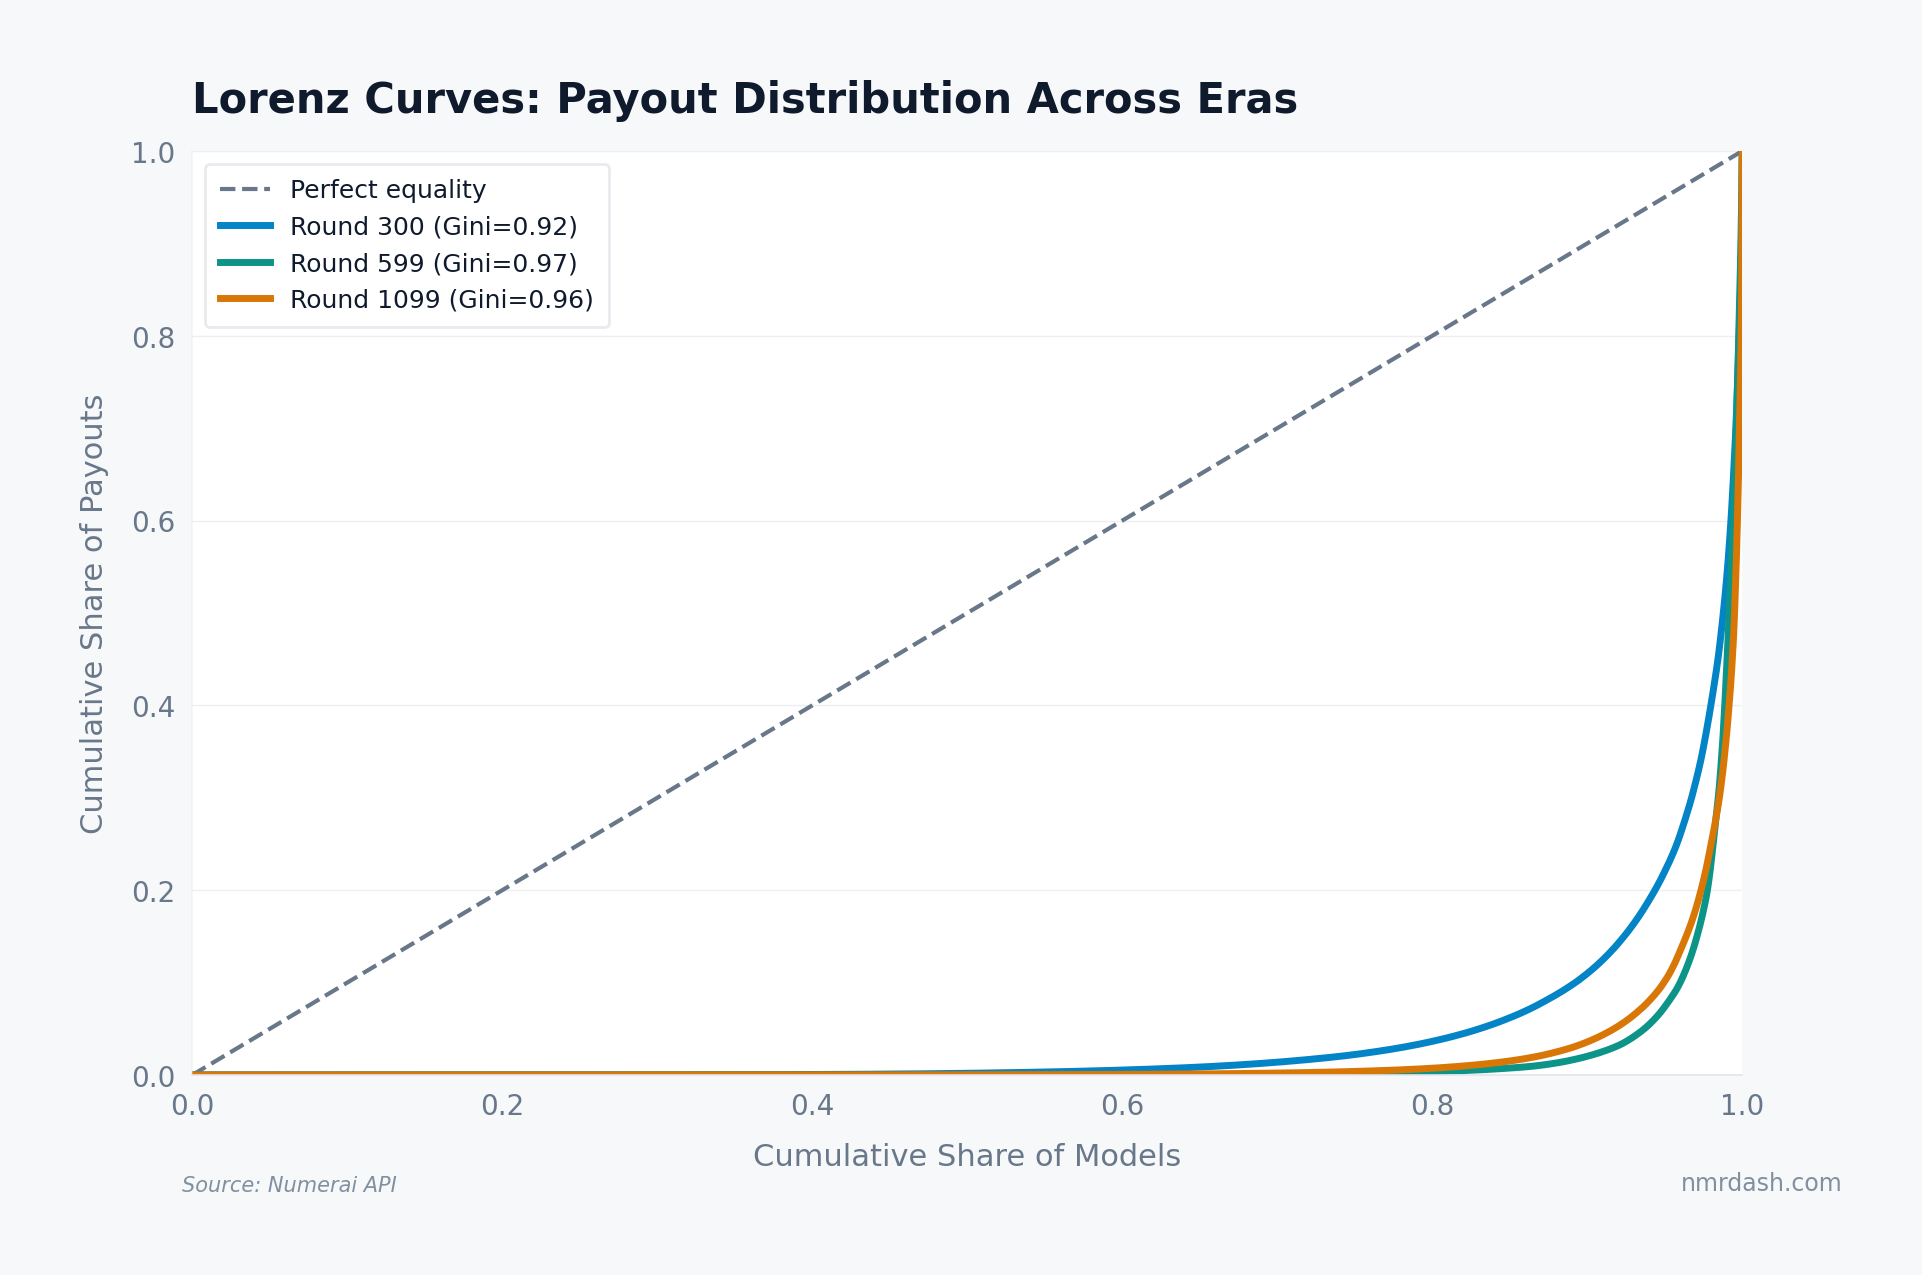
Round 300 (early era, Gini 0.92) sits well below the equality line but visibly closer to it than later rounds. Round 599 (mid era, Gini 0.97) and round 1,099 (recent era, Gini 0.96) are nearly identical — both strongly bowed, with the bottom 60–70% of models accounting for only a thin slice of total payouts.
The convergence between the mid and recent eras is the key finding. Payout inequality is not still growing. It stabilized at a high level around round 500–600, when participation and stake distributions settled into their current shape, and has held there since.
What This Means for Small Stakers
A Gini of 0.97 sounds alarming, but several structural factors work in small stakers' favor:
- Payouts scale linearly with stake. A model with 10x the stake earns roughly 10x the payout for the same score, not 100x. Absolute payout concentration can therefore be extreme even when the formula is proportional.
- Count disparity drives the Gini, not systematic extraction. Thousands of models stake tiny amounts. A few hundred stake large amounts. That alone produces a high Gini even if the system treats everyone proportionally.
- Score-based payouts reward model quality. Unlike pure capital markets where returns scale with position size, Numerai payouts depend on prediction accuracy. A small staker with a strong model earns a higher percentage return than a large staker with a weak one.
- The payout factor compresses everything. At a payout factor near 0.10, both earnings and burns are small fractions of stake. Absolute inequality in NMR terms is far lower than when the factor was 1.0 in early rounds.
The tournament is not becoming more winner-take-all in the Gini series, but it is already highly concentrated. Payout inequality tracks stake inequality with only modest extra amplification, and recent positive payouts are dominated by the top earning cohort. For small stakers, the binding constraint is model quality and stake scale — a strong model can earn, but a tiny stake will still translate into tiny absolute NMR.