Numerai Annualized Yield: What Stakers Earned Each Year
Numerai annualized staking yield fell from 96% in 2020 to 22% in 2025. The median model earned 56% in 2021 vs 1.6% in 2025 — what stakers actually saw.
The annualized Numerai staking yield has compressed by roughly 75 percentage points since 2020. Aggregate net payouts on the Classic tournament returned 96.5% of average stake in 2020, 84.5% in 2021, and 21.9% in 2025. The first 83 days of 2026 annualize to 39.6%. The median individual model fared worse: half of stakers earned less than 1.6% on their NMR over all of 2025. For a refresher on the staking mechanics, see How Numerai Works.
This article computes annualized yield two ways. The protocol-level pool subtracts burned NMR from earned NMR and divides by average stake. The typical-staker view takes each model's annual payout sum divided by its average locked stake, then reports the median across qualifying models. Both pull from resolved Classic rounds on /rounds with a non-empty open_time. Partial years are scaled to a 365-day equivalent.
Aggregate yield: the early years carried the regime
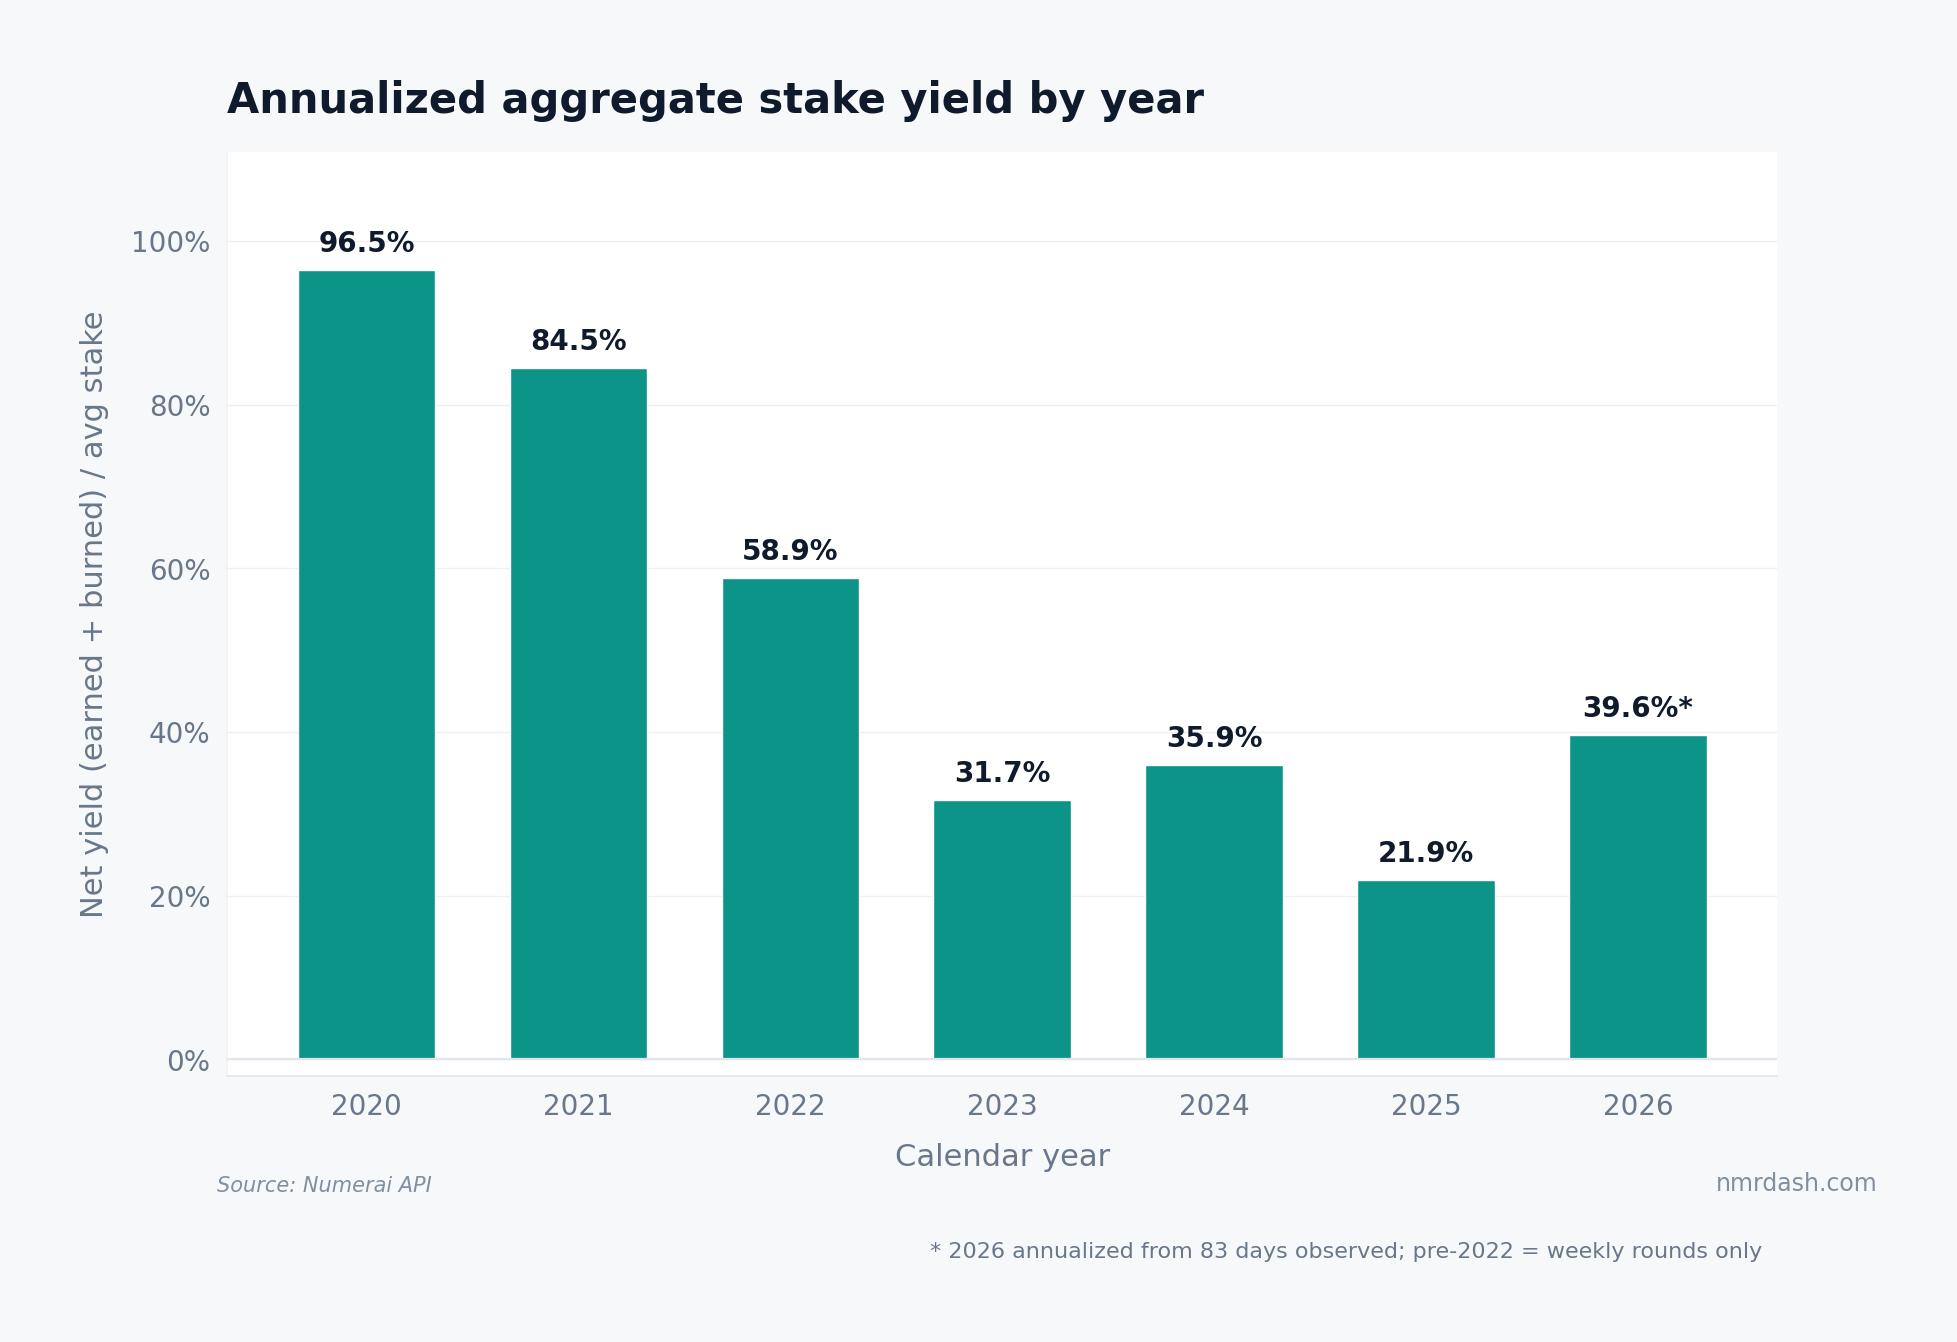
The first two full years of staked tournaments paid the highest yields the protocol has ever produced. In 2020, 52 weekly rounds settled 147,649 NMR earned against 36,399 NMR burned on an average stake of 117,898 NMR — a 94% raw return, 96.5% annualized. 2021 followed with 84.5% on a much larger 431,000 NMR average stake.
Yields then dropped to 58.9% in 2022, almost halved to 31.7% in 2023, and have stayed below 36% in every year since. Two structural shifts drive the compression. Payout factor compression pulled average payout factor from 1.00 in 2020 to 0.10 in 2023. Daily rounds launched in October 2022 and spread the same stake across more concurrent payout slots. By 2025, even with 655,000 NMR locked across 261 resolved rounds, net yield was only 21.9%. The 2026 reading is preliminary: 83 days scaled by 4.4x lands at 39.6%, but a single hot or cold week can move it.
Per-round yields are now measured in basis points
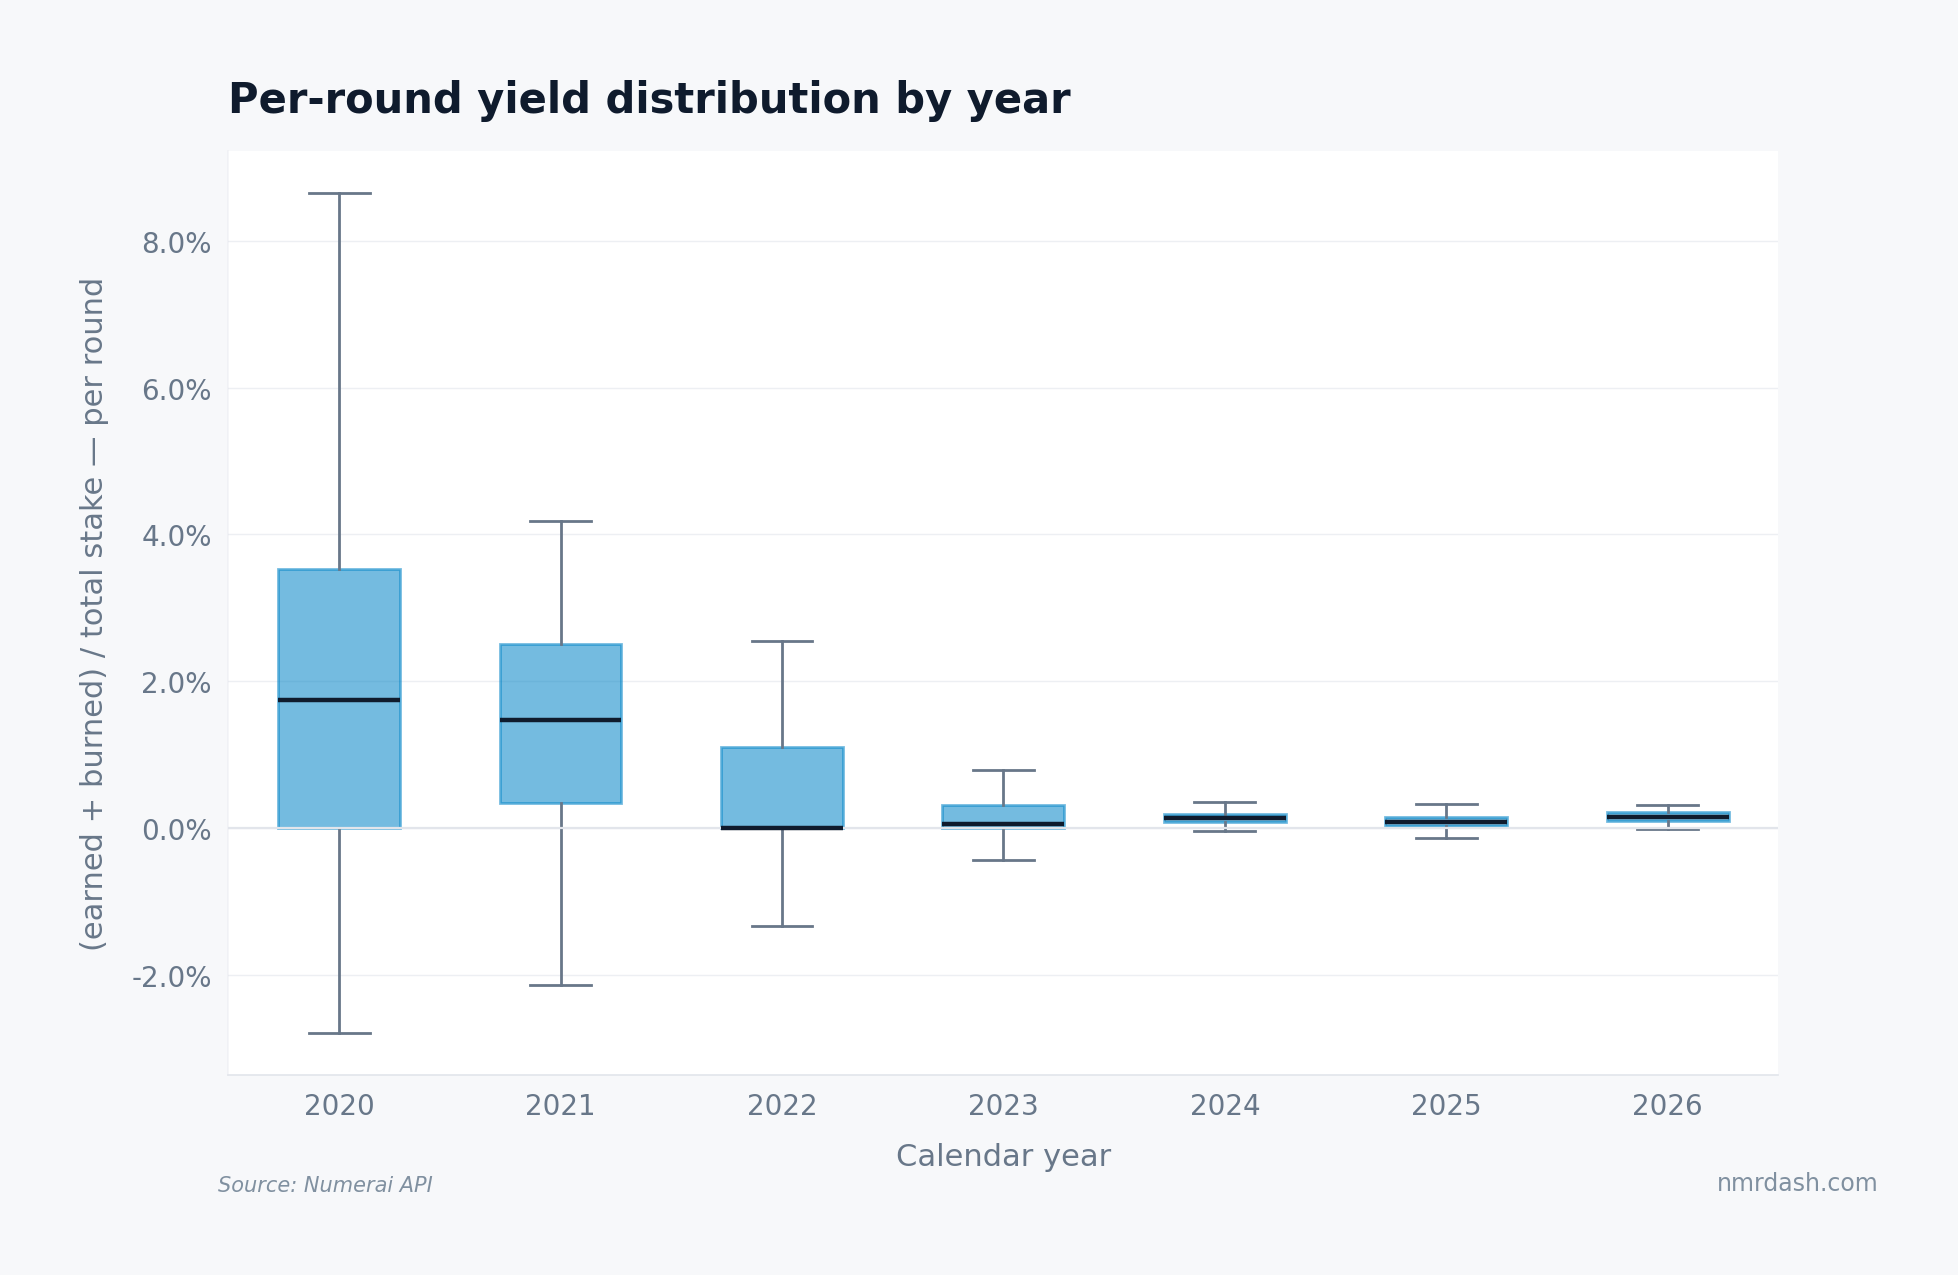
The shrinking aggregate annual yield reflects much smaller per-round returns. The median round in 2020 returned 1.74% of total stake. By 2024, the median per-round yield was 0.13%, and 2025 fell further to 0.09%. The interquartile range collapsed in lockstep — 0% to 3.5% in 2020 down to 0.026% to 0.15% in 2025.
Two effects drive the compression. The 2022 introduction of daily rounds means a single 4-week scoring period now feeds roughly 20 settling rounds instead of 4, so each round's yield divides into smaller pieces. The payout factor also ratchets down as total stake grows, throttling treasury payout flow. The median round still tilts positive every year except 2022 (median 0.00%), so the protocol has not flipped to net-burn at the round-median level.
The median model never matches the protocol
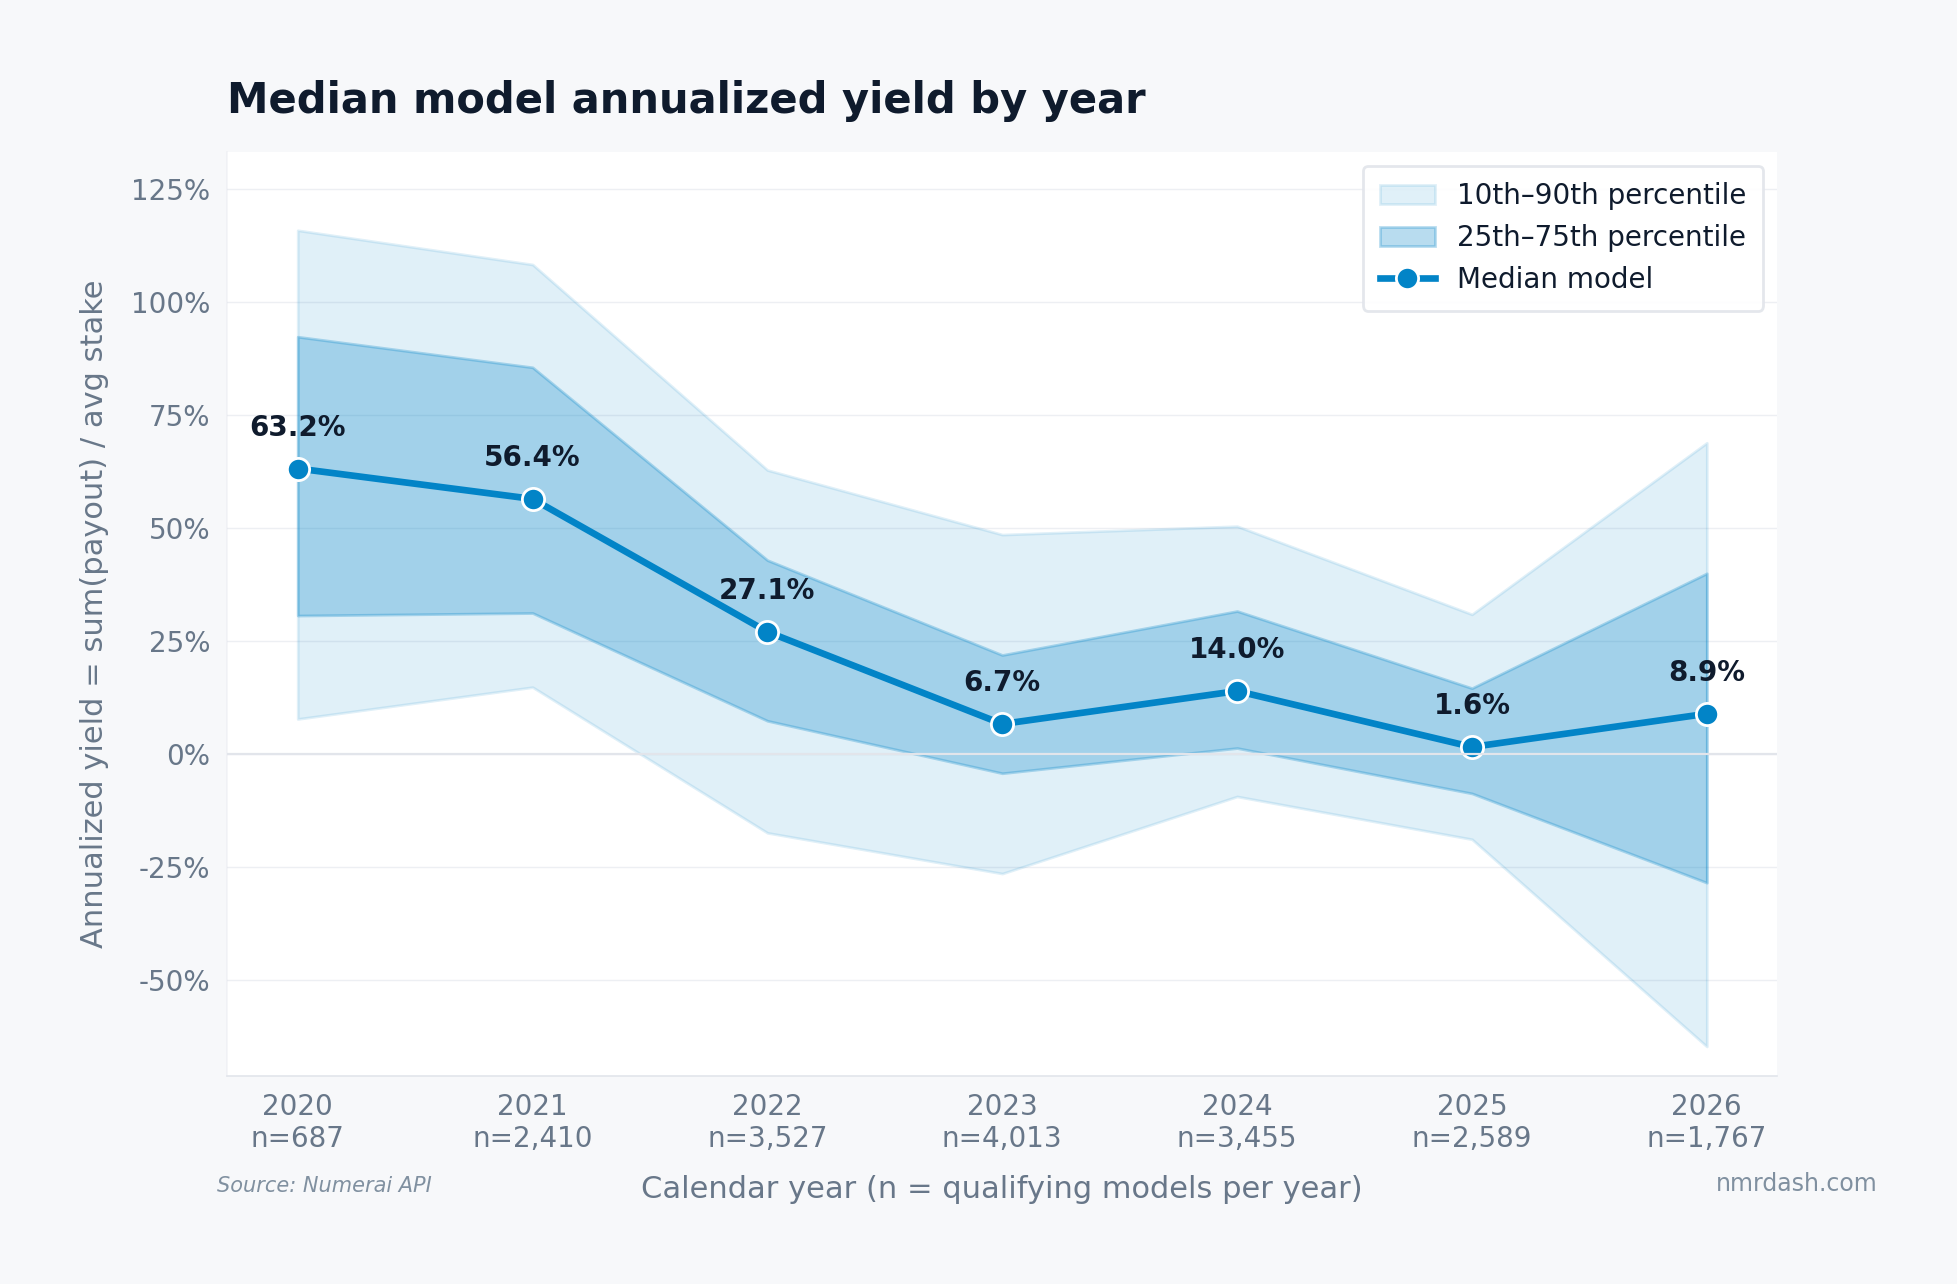
Individual models tell a different story. Across 2,589 models with at least 1 NMR average stake and 20+ rounds in 2025, the median annualized yield was 1.6%. The 25th percentile lost 8.7%, the 75th percentile earned 14.5%, and the top decile cleared 30.9%. Only 41% of qualifying models earned more than 5% annualized.
The gap between the median model and the protocol pool is structural. Aggregate pool yield is stake-weighted, so larger, better-performing staked models pull the average up. The median model is where a typical small-stake user sits, and small stakers historically run more volatile, less-tuned submissions. In 2020 and 2021, a 60% median meant most participants earned real returns. By 2025, the median was indistinguishable from zero. See /leaderboard for which models actually delivered.
Pool yield versus the typical staker
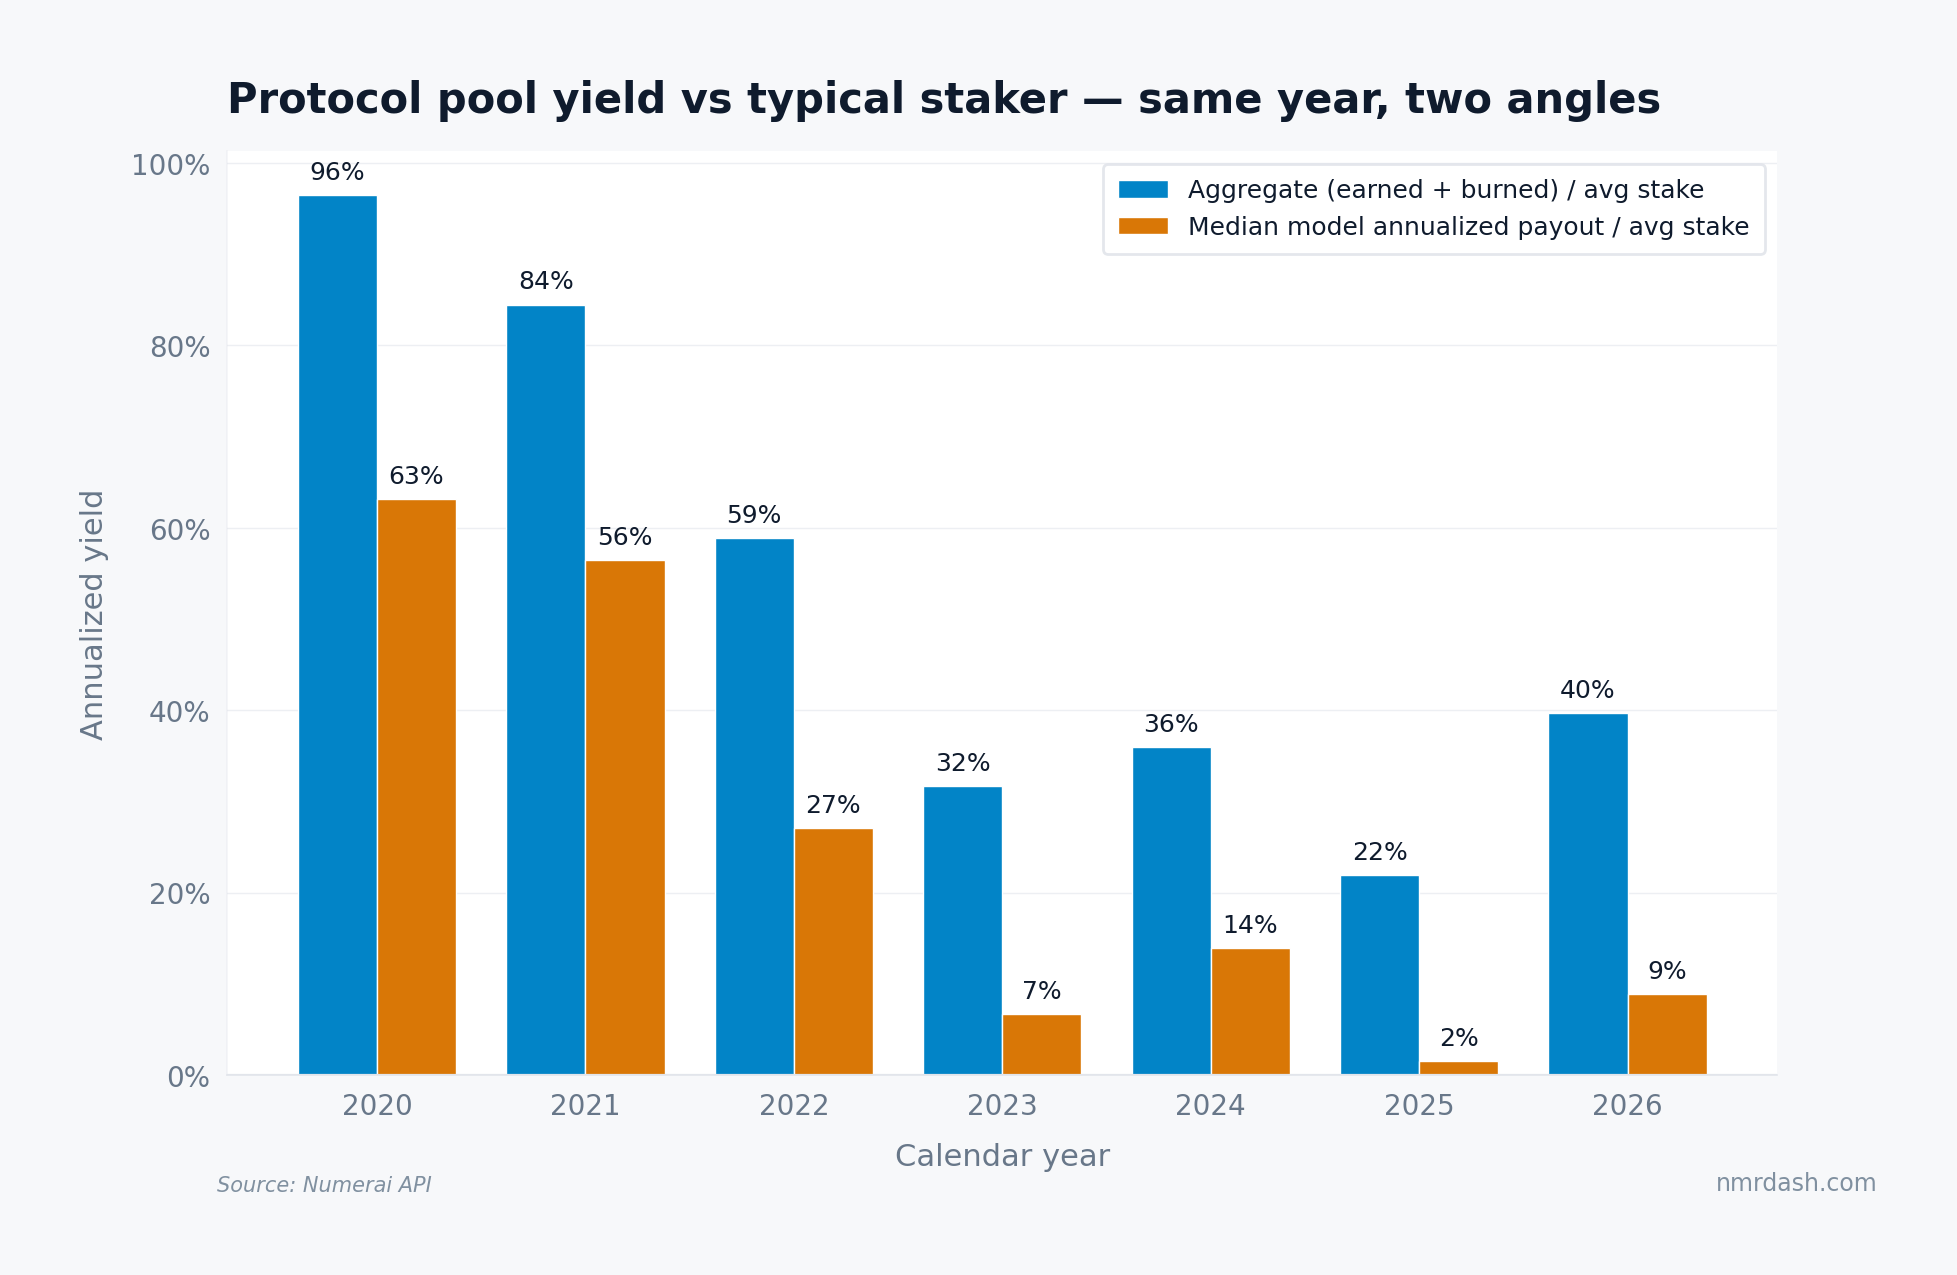
The protocol pool has out-yielded the median staker every year. The gap was 33 percentage points in 2020 (96% vs 63%), 32 points in 2022 (59% vs 27%), and 22 points in 2024 (36% vs 14%). In 2025 the gap shrank in absolute terms but widened proportionally: 22% vs 2%, leaving the median model at less than a tenth of the protocol's headline. Stake-weighted aggregation flatters returns because large stakers concentrate in models with strong BMC and MMC and capture more of the cash flow than the average model.
The implication for a yield-seeking staker is direct: do not assume you will earn the headline aggregate yield. The realistic prior for a new model with random hyperparameters is the median or 25th percentile, which lands at 0% to negative 9% in 2025. On a return-rate basis, the bottom 60% of models earned less than a 5% USD risk-free benchmark before even considering NMR/USD volatility.
What this means for stakers in 2026
Numerai staking yield is no longer a broad 50-90% annualized opportunity, and hasn't been since 2021. The aggregate pool still pays: 1.39 million net NMR has flowed to stakers across all years combined. The distribution has shifted, though. Most of that flowed in 2020-2022 when stakes were small and payout factors were high. The 2025 reality is a 22% aggregate yield and a near-zero median, with the top decile still clearing 30%+.
Performance dispersion now matters more than the headline number. Track /trends for live round-level yields, study what separated 2024's winners in the model archetypes breakdown, and read the break-even analysis for the MMC threshold needed to turn a profit under a compressed payout factor.