Model Archetypes: Five Numerai Quant Profiles
Clustering 19,000 Numerai models by MMC, CORJ60, BMC, and FNCv3 reveals five archetypes. Contrarians retain at 71%; High-Volatility models burn out at 2x the rate.
Numerai's tournament hosts over 19,000 models, but they are not all playing the same game. Some chase MMC (meta-model contribution) by finding signals the meta-model misses. Others score consistently on every metric without excelling at any one. Still others spike in one dimension and collapse in another.
We averaged each model's four primary metrics — MMC, CORJ60 (60-day correlation to the target), BMC (benchmark-model contribution), and FNCv3 (feature-neutral correlation v3) — over the last 100 weekly rounds. Classifying by percentile signatures, five distinct archetypes emerge.
The Five Archetypes
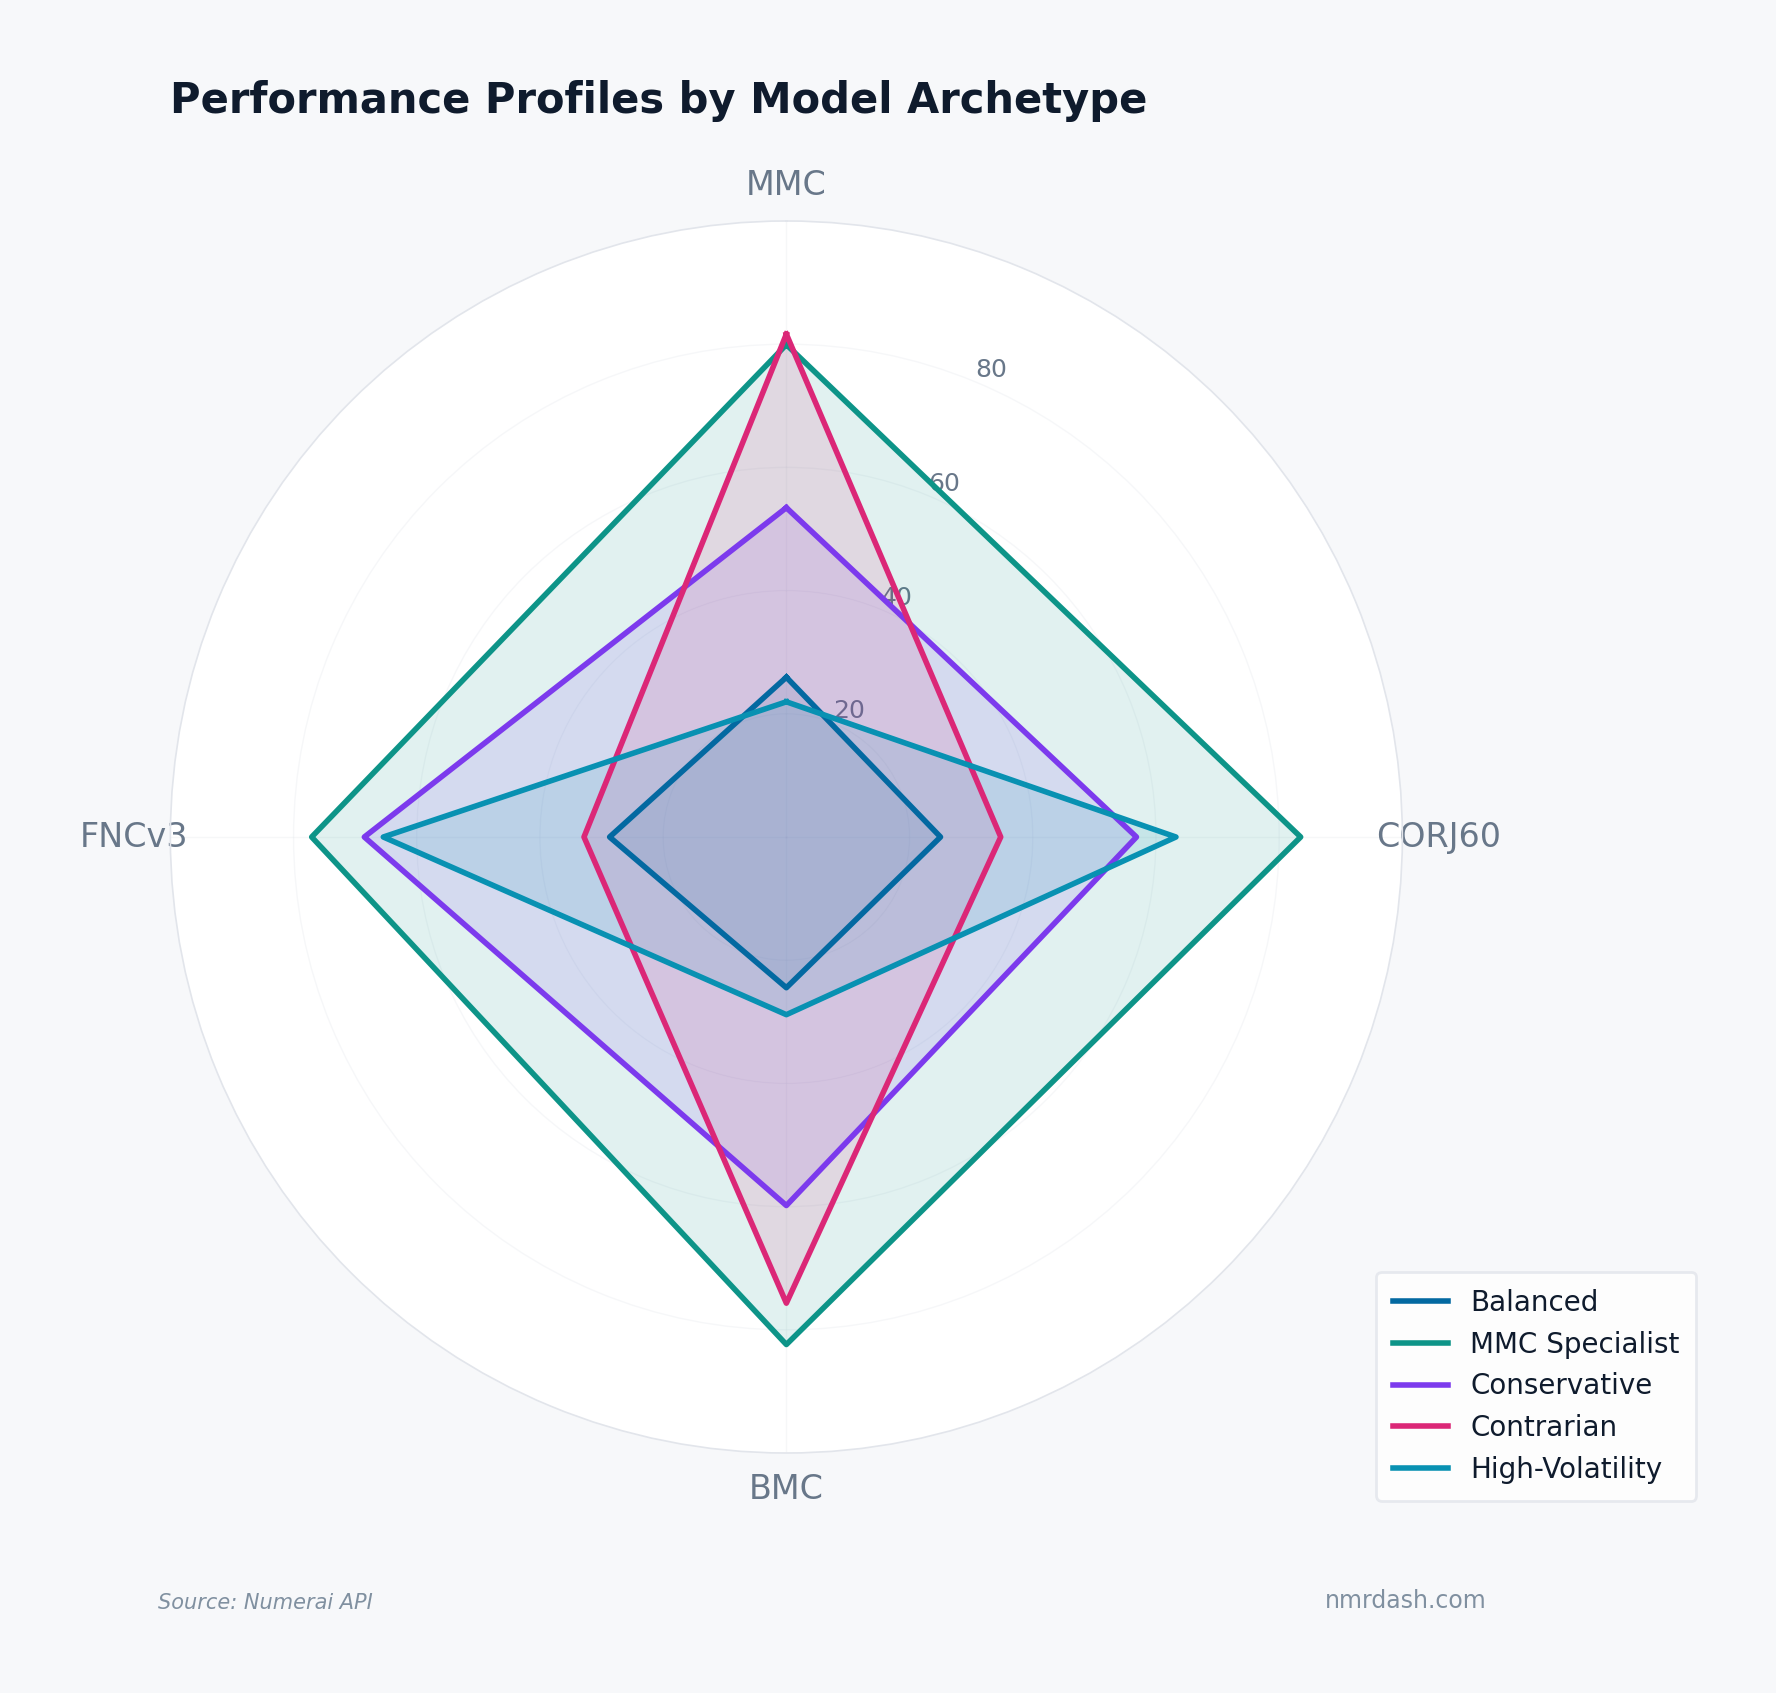
Each archetype's median percentile on the four metrics produces a distinct radar shape:
- Balanced (7,809 models, 40%) — The largest group. Sits in the lower-middle of the field, with median percentiles in the 25-30 range on all four metrics and a roughly symmetric polygon near the center. These models avoid catastrophic weakness but do not stand out on any single metric. The chart does not identify implementation style, only metric profile.
- MMC Specialist (4,560 models, 23%) — High on both MMC and CORJ60, with strong BMC and FNCv3. Their polygon extends outward on all axes, especially toward MMC and CORJ60. These models score well on meta-model contribution and correlation simultaneously.
- Conservative (2,921 models, 15%) — Above-median on all metrics but with the tightest polygon of the group. No extreme highs, no extreme lows. Optimized for stability rather than peak performance.
- Contrarian (2,151 models, 11%) — The most distinctive shape: high MMC but below-median CORJ60. These models contribute unique alpha to the meta-model because they diverge from the consensus prediction. The gap between their MMC and CORJ60 percentiles is the largest of any archetype.
- High-Volatility (1,982 models, 10%) — A split profile: near the 60th percentile on CORJ60 and FNCv3 but below the 20th on MMC and BMC. Concentrated bets on specific features or market regimes produce extreme scores in both directions.
Cluster Separation in PCA Space
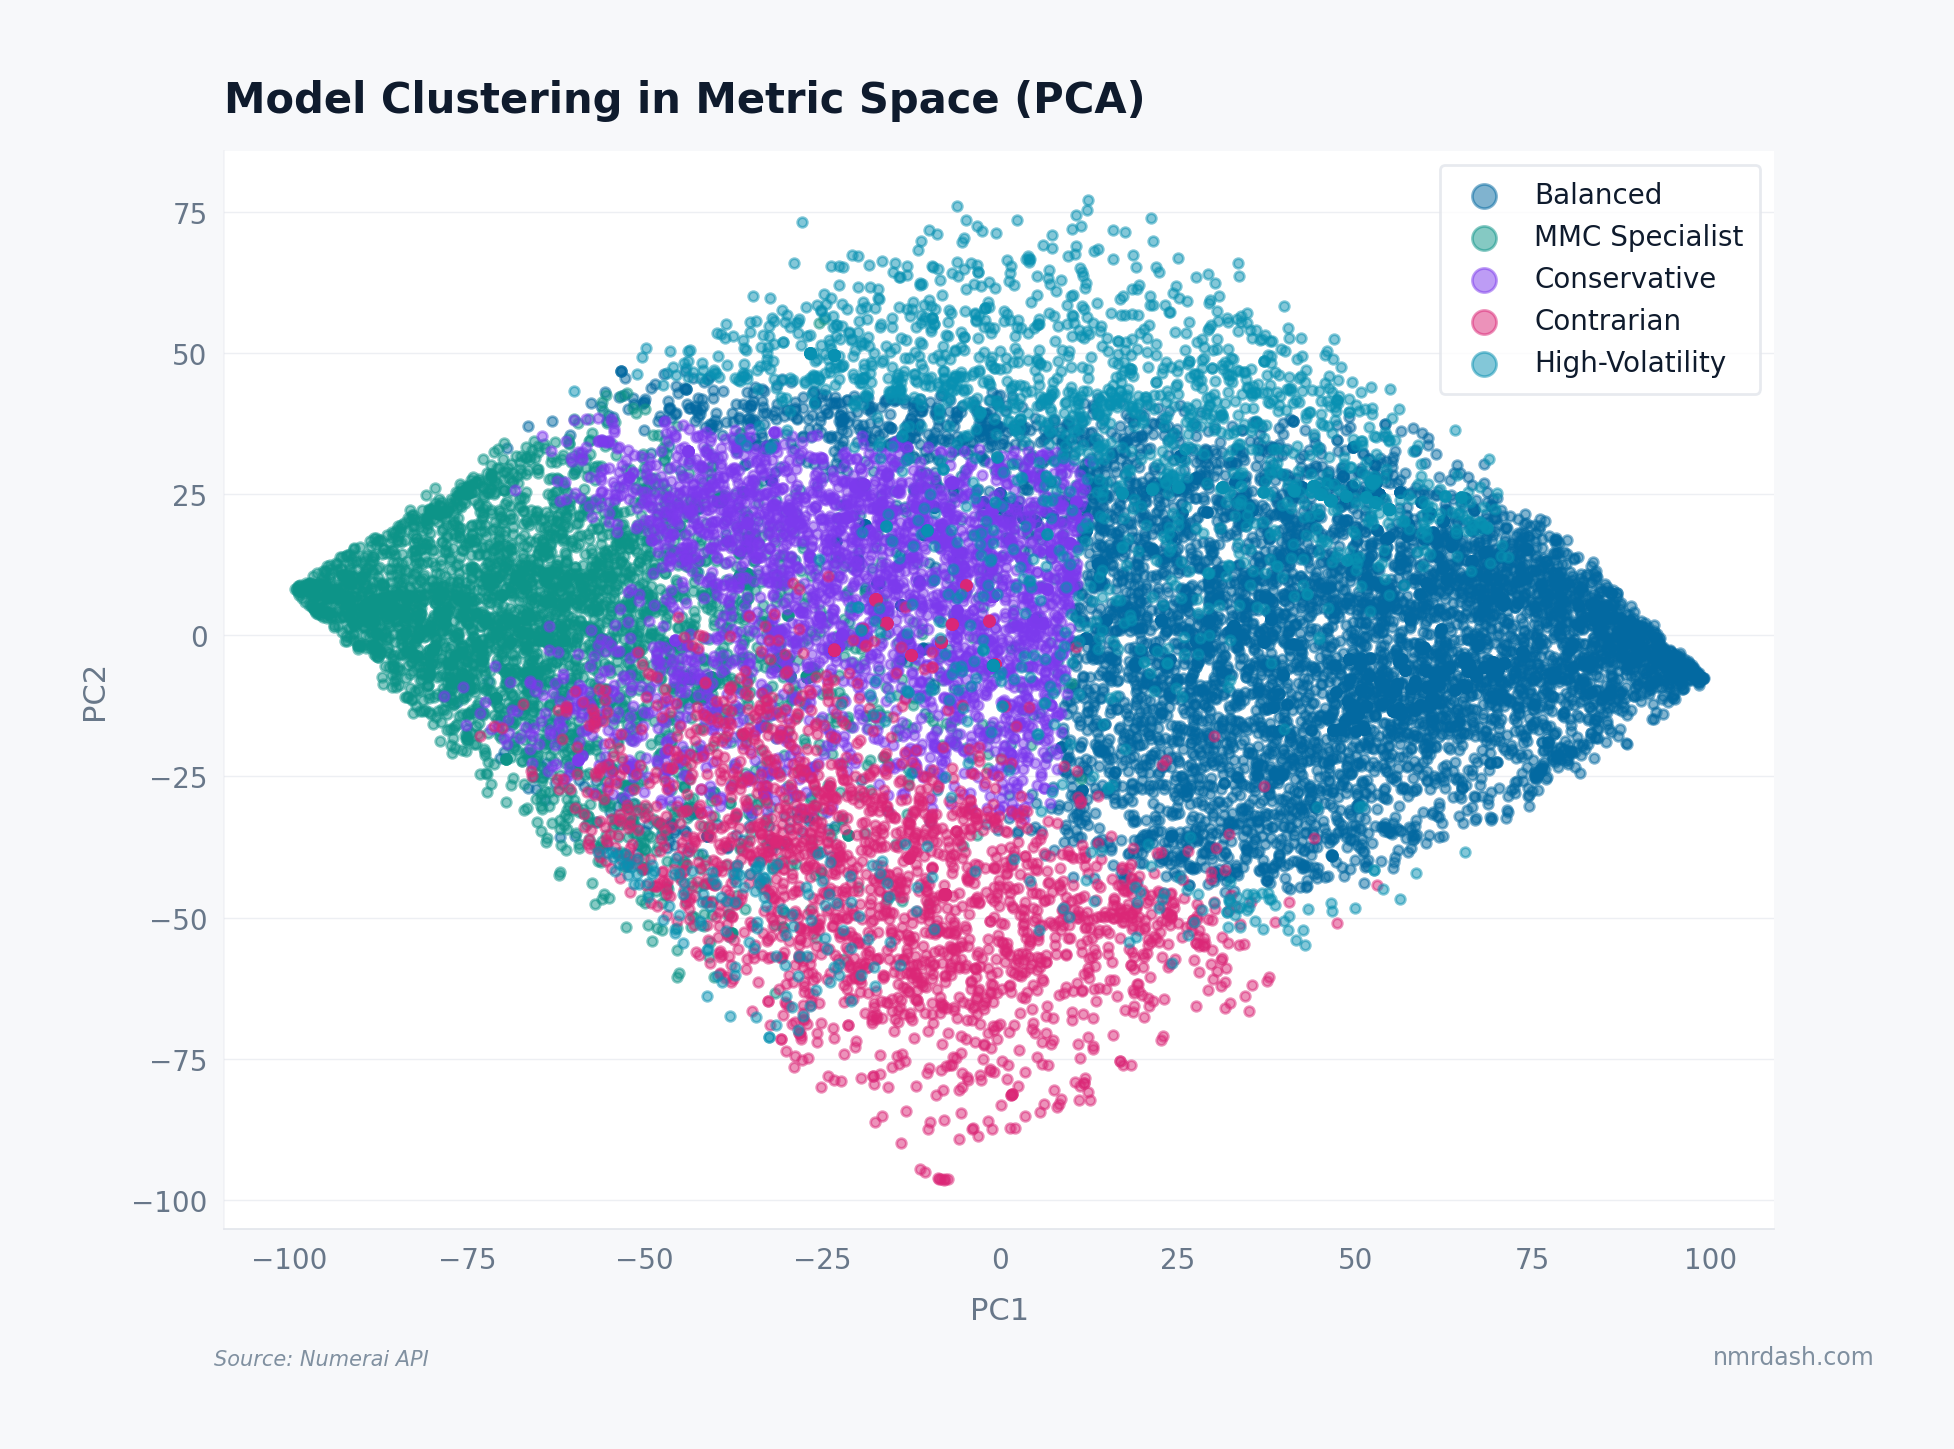
Projecting the four metrics down to two principal components shows that the labels have visible separation in the four-metric space. MMC Specialists (green) cluster on the left, Balanced models (dark blue) spread across the right side, and Contrarians (pink) occupy the lower-center. The Conservative cluster (purple) sits in the upper-middle, and High-Volatility models (light teal) fan across the top, overlapping both wings.
The diamond-shaped boundary reflects a constraint of percentile-ranked data: simultaneous extremes on all four metrics are uncommon. Specialists and high-volatility models populate the edges, while Balanced and Conservative approaches dominate the core.
Retention by Archetype
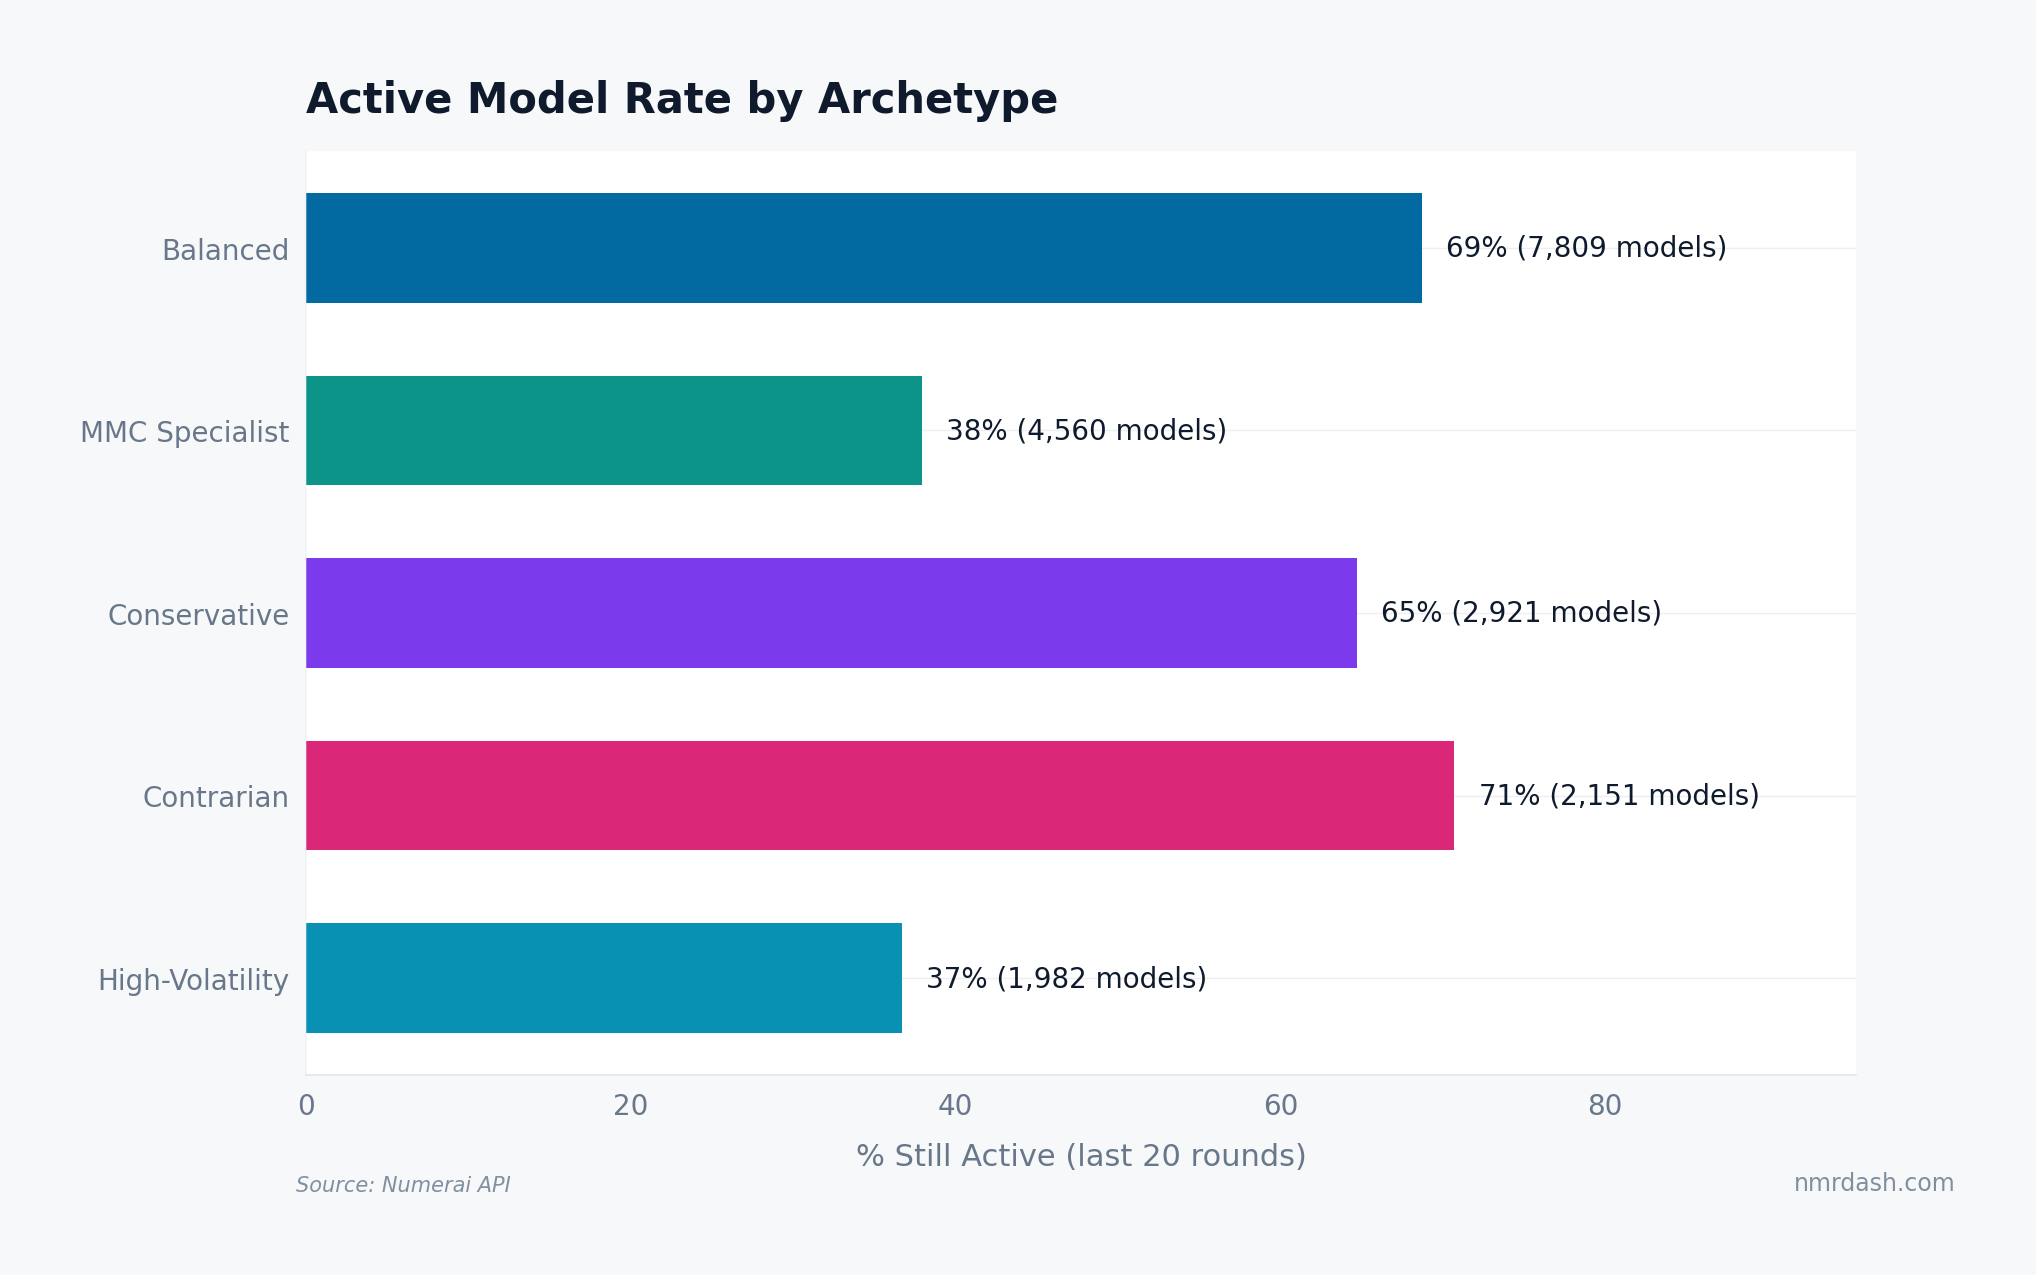
Of the models active in the last 100 weekly rounds, the percentage still staking in the most recent 20 rounds reveals which strategies persist. The spread is nearly 2x from top to bottom.
Contrarians lead at 71%. Their unique alpha and above-average MMC produce enough payouts to justify continued staking, even though their CORJ60 lags. The tournament rewards differentiated signals.
Balanced models follow at 69%. Balanced models may persist because their metric profile avoids obvious failure modes, but retention alone does not prove lower downside variance.
Conservative models retain at 65%. Stability keeps them in the game, though their lower ceiling may explain the gap versus Contrarians.
MMC Specialists and High-Volatility models share the bottom at 37-38%. This is surprising for MMC Specialists, given their strong absolute scores. One possible explanation is stake concentration or higher exposure to regime shifts, but the chart does not isolate the mechanism. High-Volatility models face the same broad problem amplified: extreme bets mean extreme drawdowns, and drawdowns kill participation.
Archetype appears related to model longevity.
The Metric Behind Retention
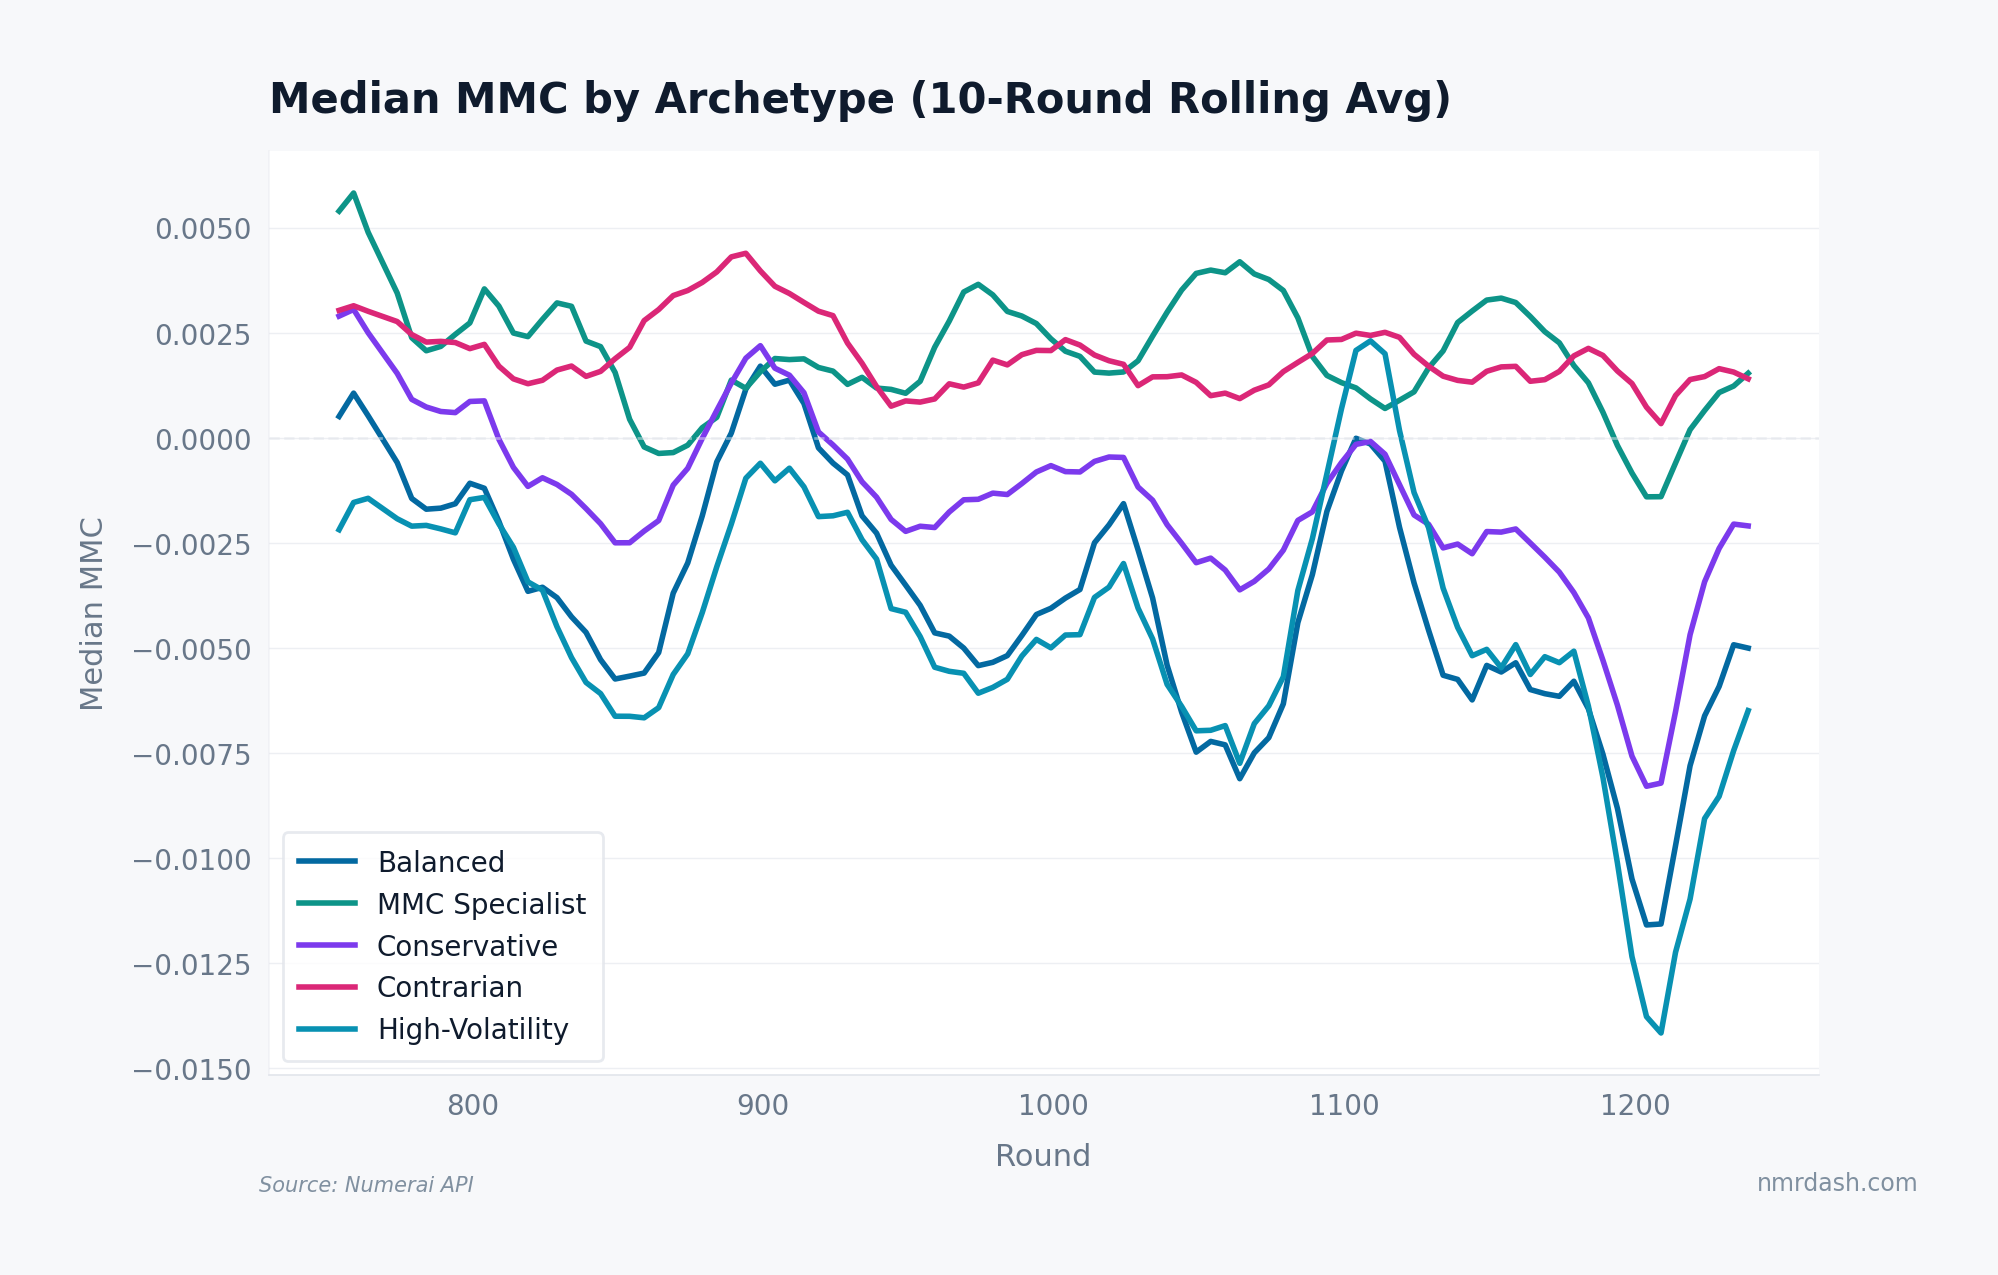
Round-by-round median MMC explains the retention gap. Contrarians hold the steadiest positive median MMC of any archetype, roughly +0.001 to +0.004 across the whole window. MMC Specialists post the highest peaks but swing harder, dipping negative in stretches around rounds 860-880 and 1200. Balanced and High-Volatility models spend most rounds below zero and plunge to -0.012 and -0.014 near round 1200, with Conservative oscillating in between.
Because MMC carries a 2x multiplier in the payout formula, a persistently positive median is what keeps an archetype earning — consistent with the broader staking profitability picture, where the median model hovers near break-even. But archetype alone does not guarantee profitability. It determines the shape of your returns distribution, not the center.
Practical Takeaways
If you operate a single model, check which archetype it falls into. Compare your average MMC and CORJ60 percentiles over the last 100 rounds on the models page. If your MMC is high but your CORJ60 is below median, you are a Contrarian — historically the most durable strategy.
If you run multiple models, diversifying across archetypes may matter more than diversifying within one. A Contrarian paired with a Conservative has less correlated drawdowns than two models from the same cluster. The diversification paradox applies at the archetype level too.
If you are starting out, the Balanced archetype's 69% retention shows that generalist approaches survive without requiring a strong thesis. But their median MMC spends most rounds below zero. The Contrarian path — building signals that deliberately diverge from the consensus — offers better retention and the steadiest positive MMC, at the cost of lower CORJ60 scores that can feel discouraging round by round.
The meta-model does not need more of the same. It needs models that see what others miss. The retention pattern is consistent with Numerai rewarding differentiated models over time.