Break-Even Analysis: The Minimum Viable Numerai Model
With the payout factor near 0.1, many Numerai models fall below break-even each round. Here's the minimum MMC and CORJ60 needed to profit.
In 2020, a Numerai model that cleared the break-even score won 70.9% of its rounds and the median round paid 2.1% of stake. In 2025, win rates fell to 53.9% and the median round paid 0.03%. The math defining "break even" hasn't changed — what counts as economically viable has.
The payout formula is: Payout = stake x clip(0.5 x CORJ60 + 2.0 x MMC, -0.25, 0.25) x payout_factor. CORJ60 measures your model's correlation with targets over a 60-day window. MMC (Meta-Model Contribution) measures how much unique signal your predictions add beyond what the crowd already provides. The break-even condition on score is still 0.5 x CORJ60 + 2.0 x MMC > 0. A model clears this bar when its MMC contribution outweighs any drag from negative correlation. But score alone is not enough. With the payout factor near 0.1, models that break even on score earn a fraction of what the same performance returned three years ago.
How Many Models Break Even?
The break-even percentile tracks what fraction of models fall below the zero-score threshold each round.
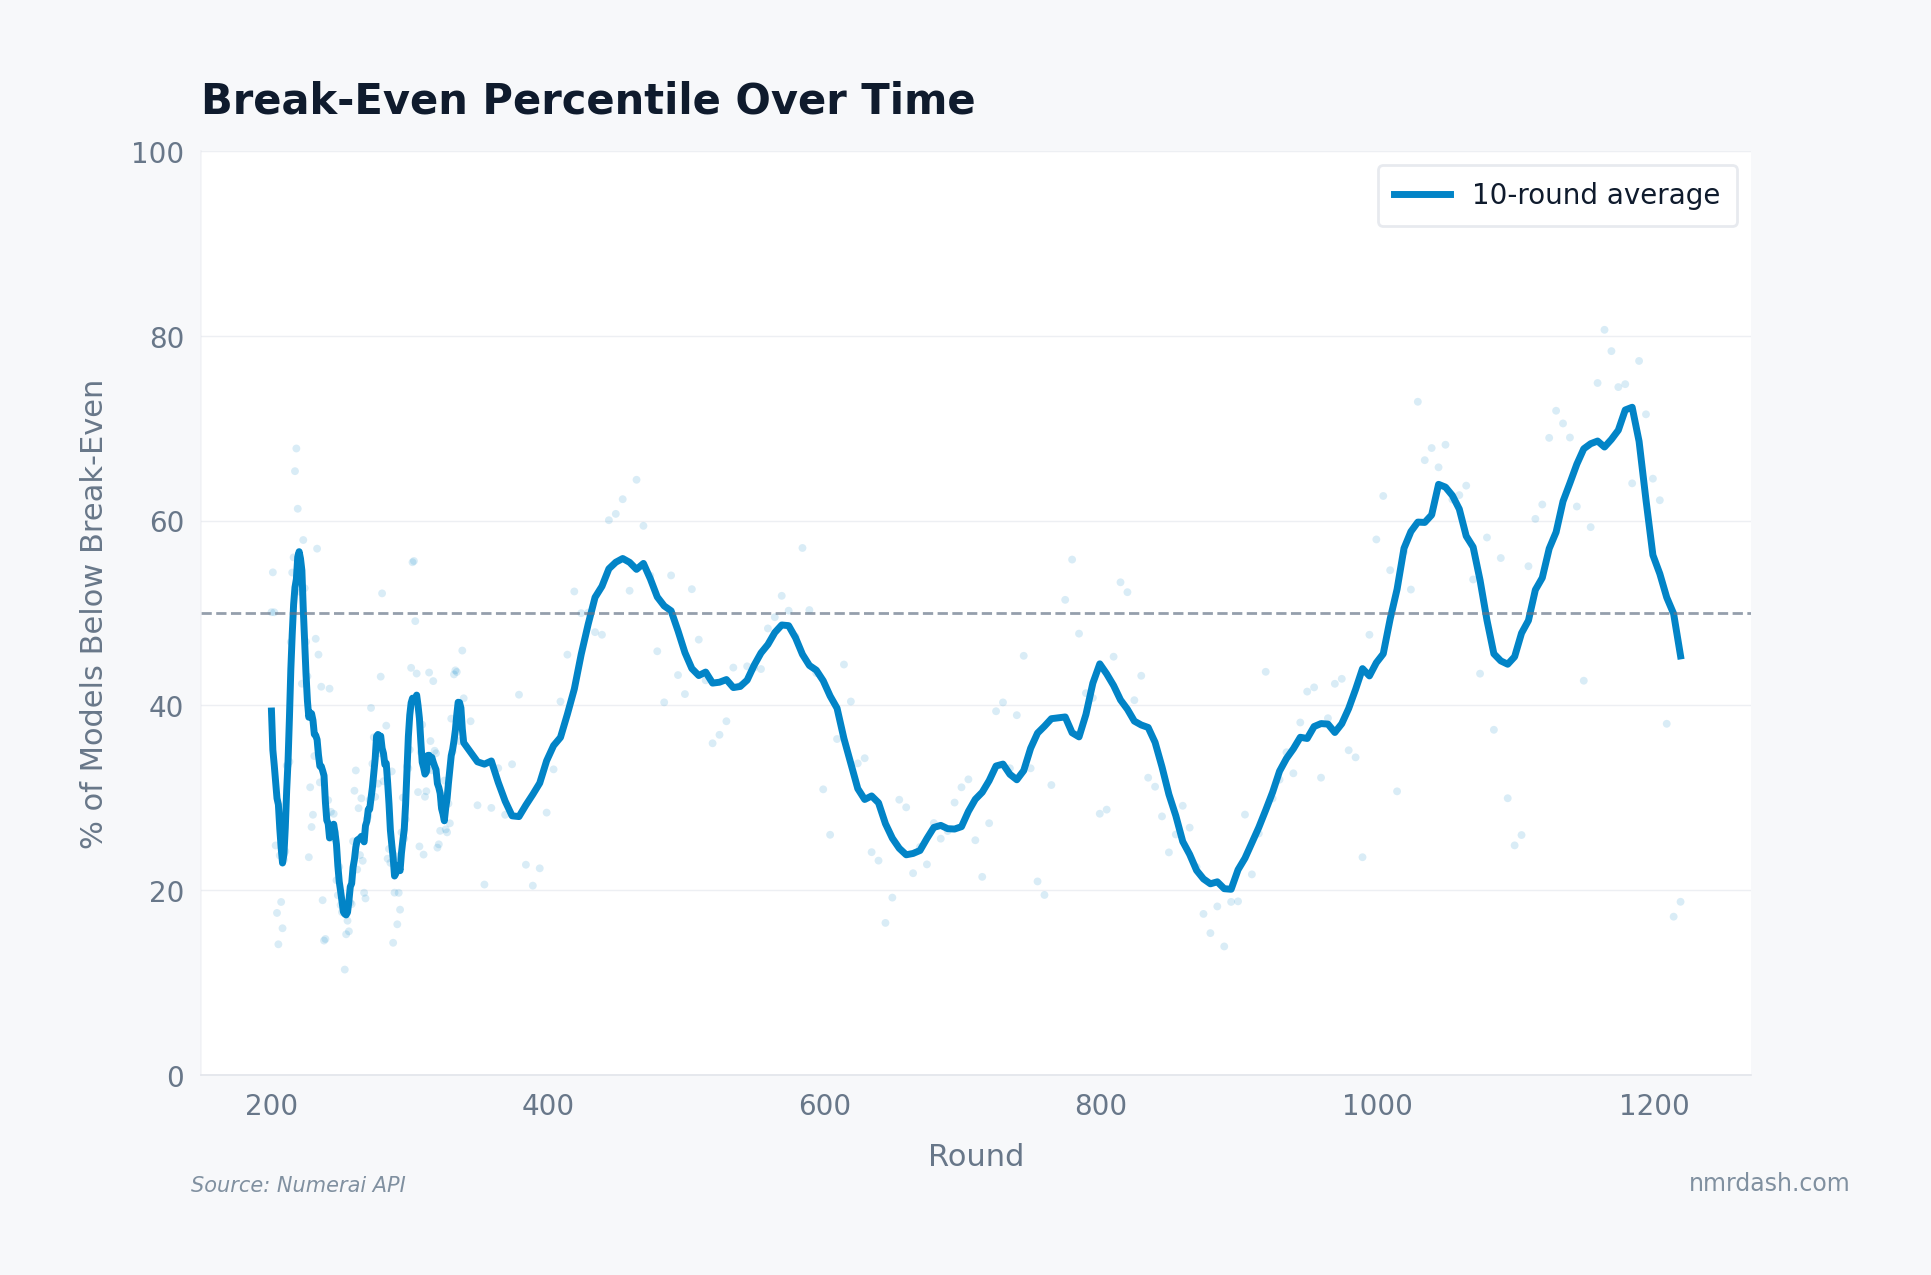
The rolling average swings between roughly 20% and 70%. Recent rounds peaked near the 70% mark before falling back toward the middle of the historical band. The peaks coincide with difficult market regimes where even consensus predictions underperform.
The break-even bar is not stable. It shifts with market conditions, meta-model composition, and model crowding. The percentage below break-even has moved in long waves rather than around a stable baseline, which matters more than any single recent print.
Payout Factor Compression
Breaking even on score is necessary but not sufficient. The payout factor determines how much NMR a given score actually pays out.
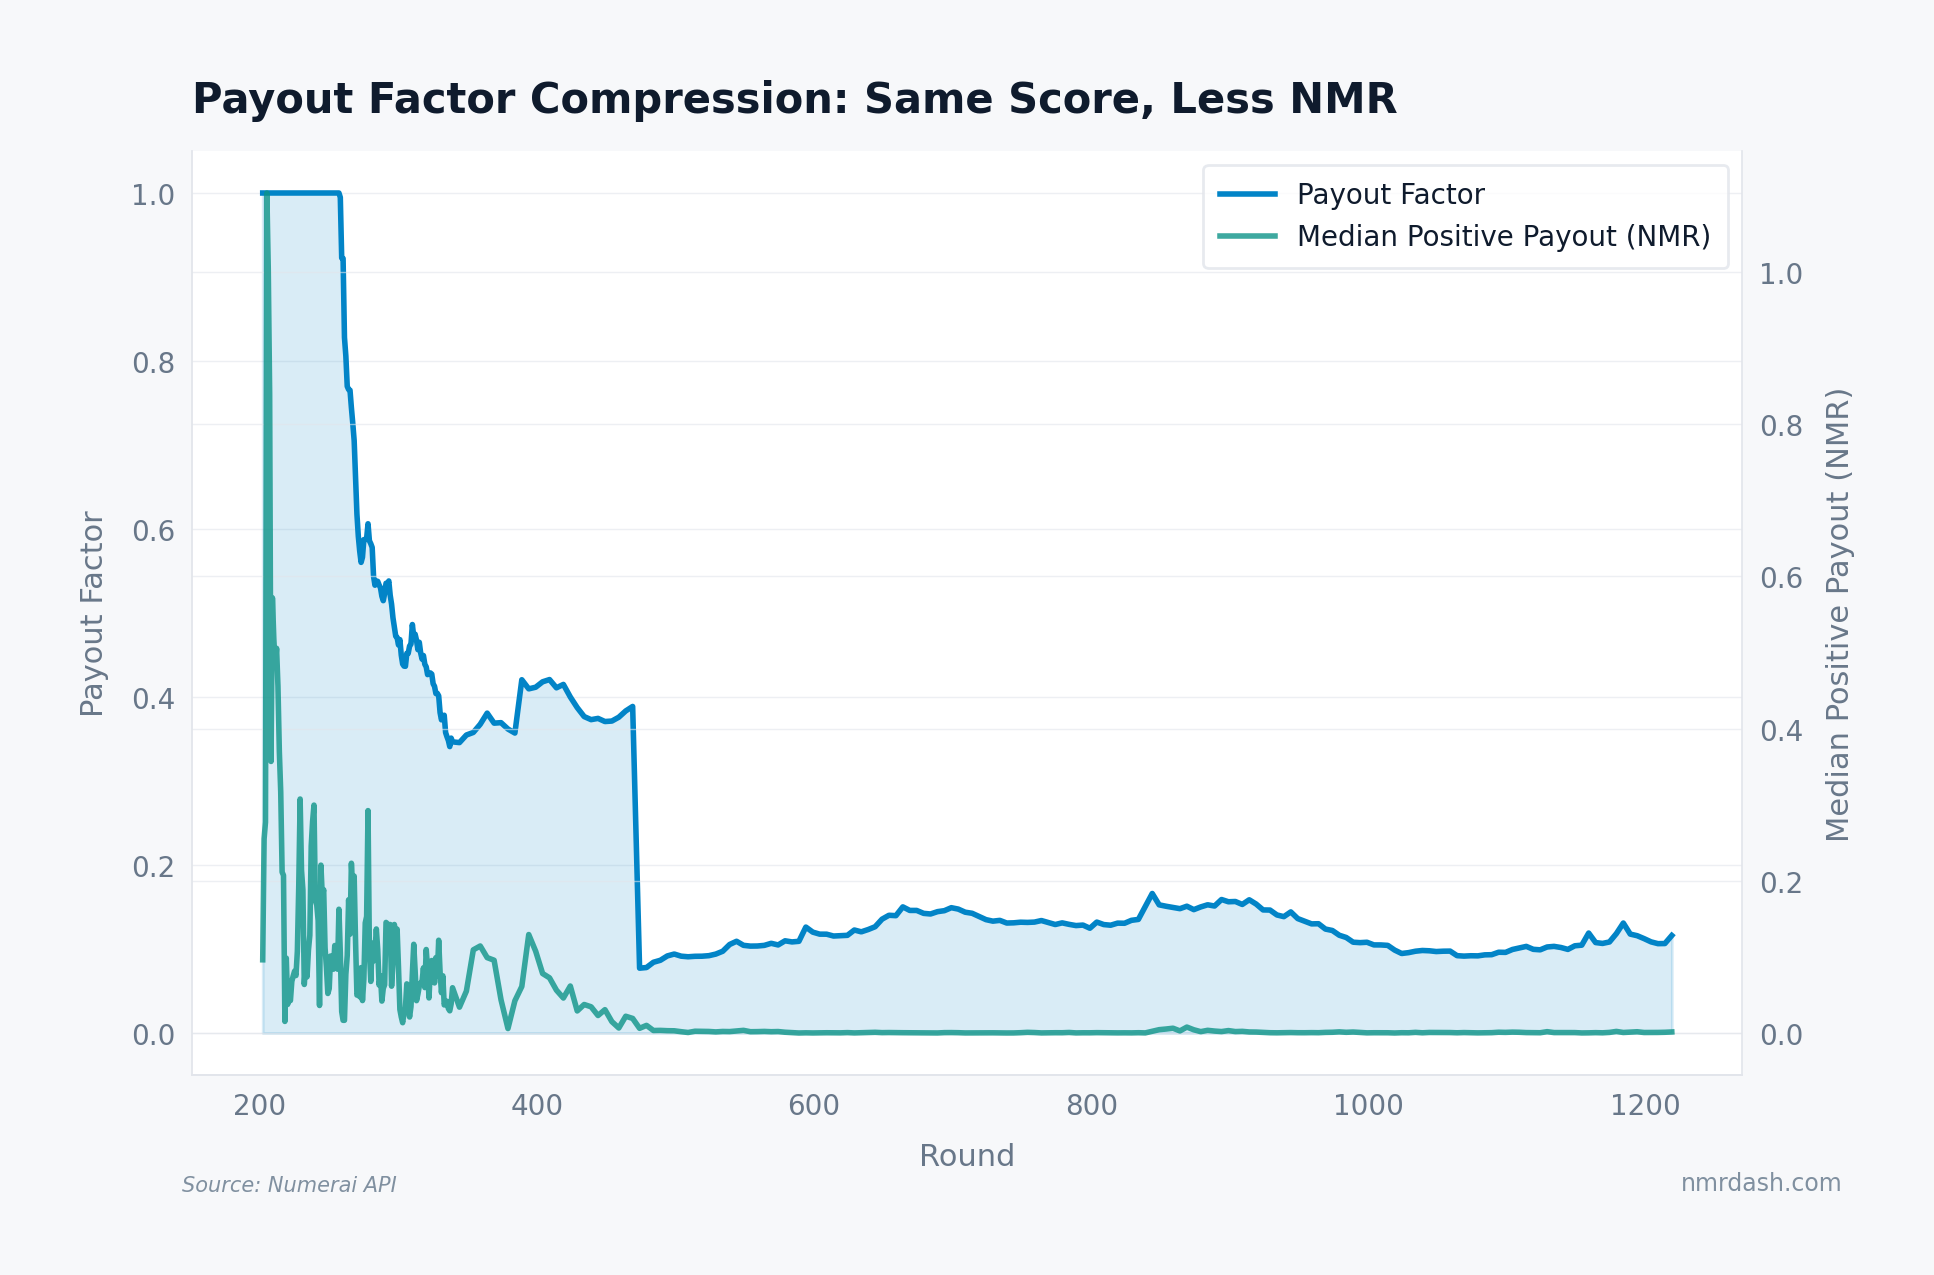
The payout factor dropped from 0.5-1.0 in the early rounds to roughly 0.1 by round 500, and it has stayed compressed since. The median positive payout tracked it step for step: a model earning 0.3 NMR per round in the high-factor era earns closer to 0.03 NMR on the same score in the compressed-factor era.
Fewer models break even, and those that do earn far less per unit of stake. A new 2026 participant faces a higher performance bar and a lower reward for clearing it than early-era stakers did. For how the factor interacts with total tournament economics, see Round Economics.
Profitability Across Eras
Dividing tournament history into 200-round eras shows how profitability has shifted over time.
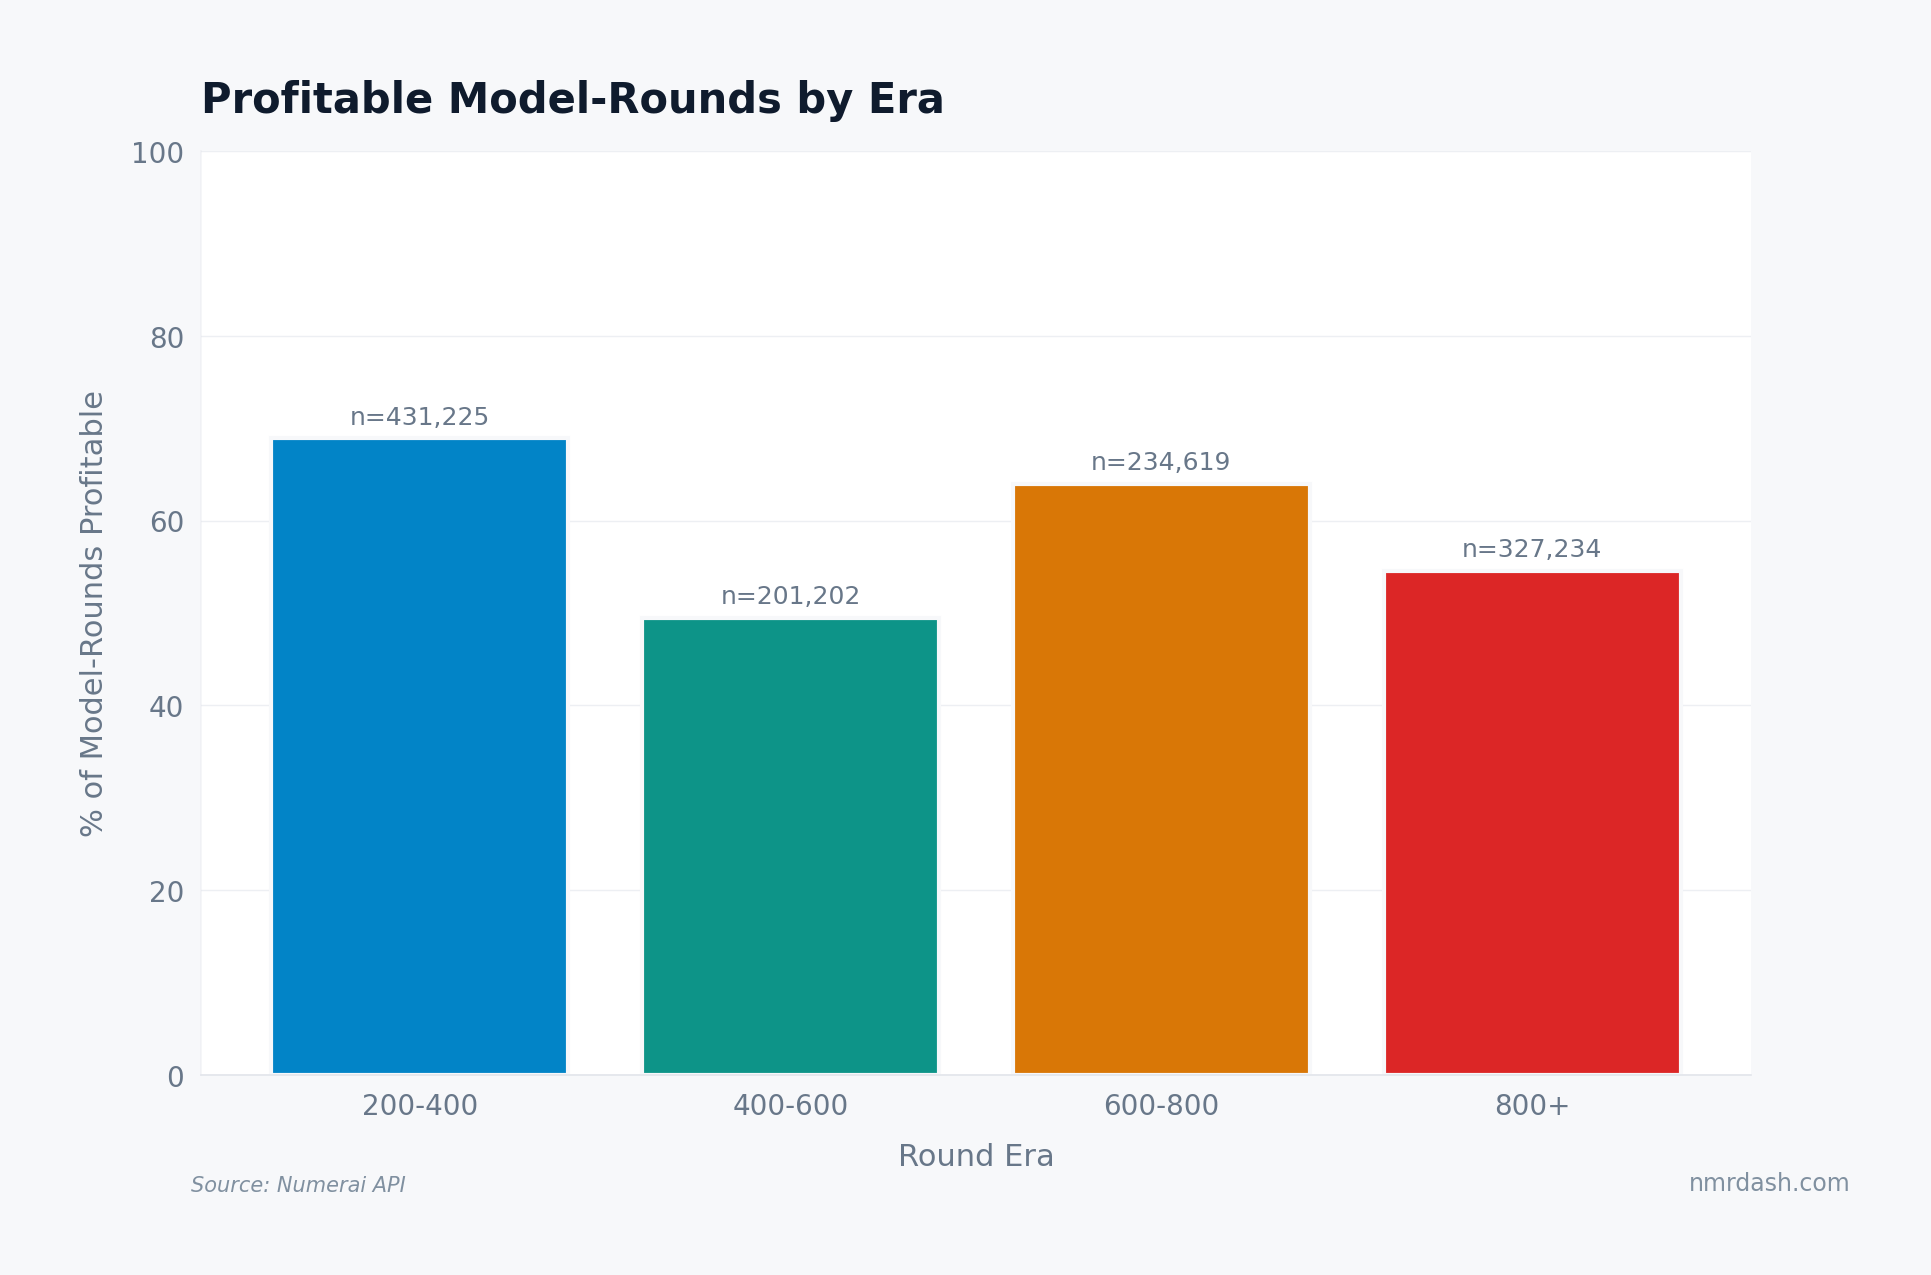
The early era (rounds 200-400) was the most profitable: 69% of 431,000 model-round observations posted a positive payout. The 400-600 era hit a trough at 50%, roughly even between positive and negative payouts. Rounds 600-800 recovered to 64%, likely reflecting improved model quality and some weaker models exiting. The 800+ era sits at 53% across 327,000 observations.
Profitability rates oscillate with market conditions and meta-model dynamics. But the compressed payout factor means absolute NMR earned per positive model-round is far lower than in the 200-400 era. A 53% profitability rate at a 0.1 payout factor pays less than 69% at a 0.5 factor.
The MMC Threshold
Rearranging the break-even formula gives the minimum MMC needed: MMC > -0.25 x CORJ60. When CORJ60 is negative, a model needs positive MMC to compensate. When CORJ60 is positive, the model has a buffer and can tolerate some negative MMC.
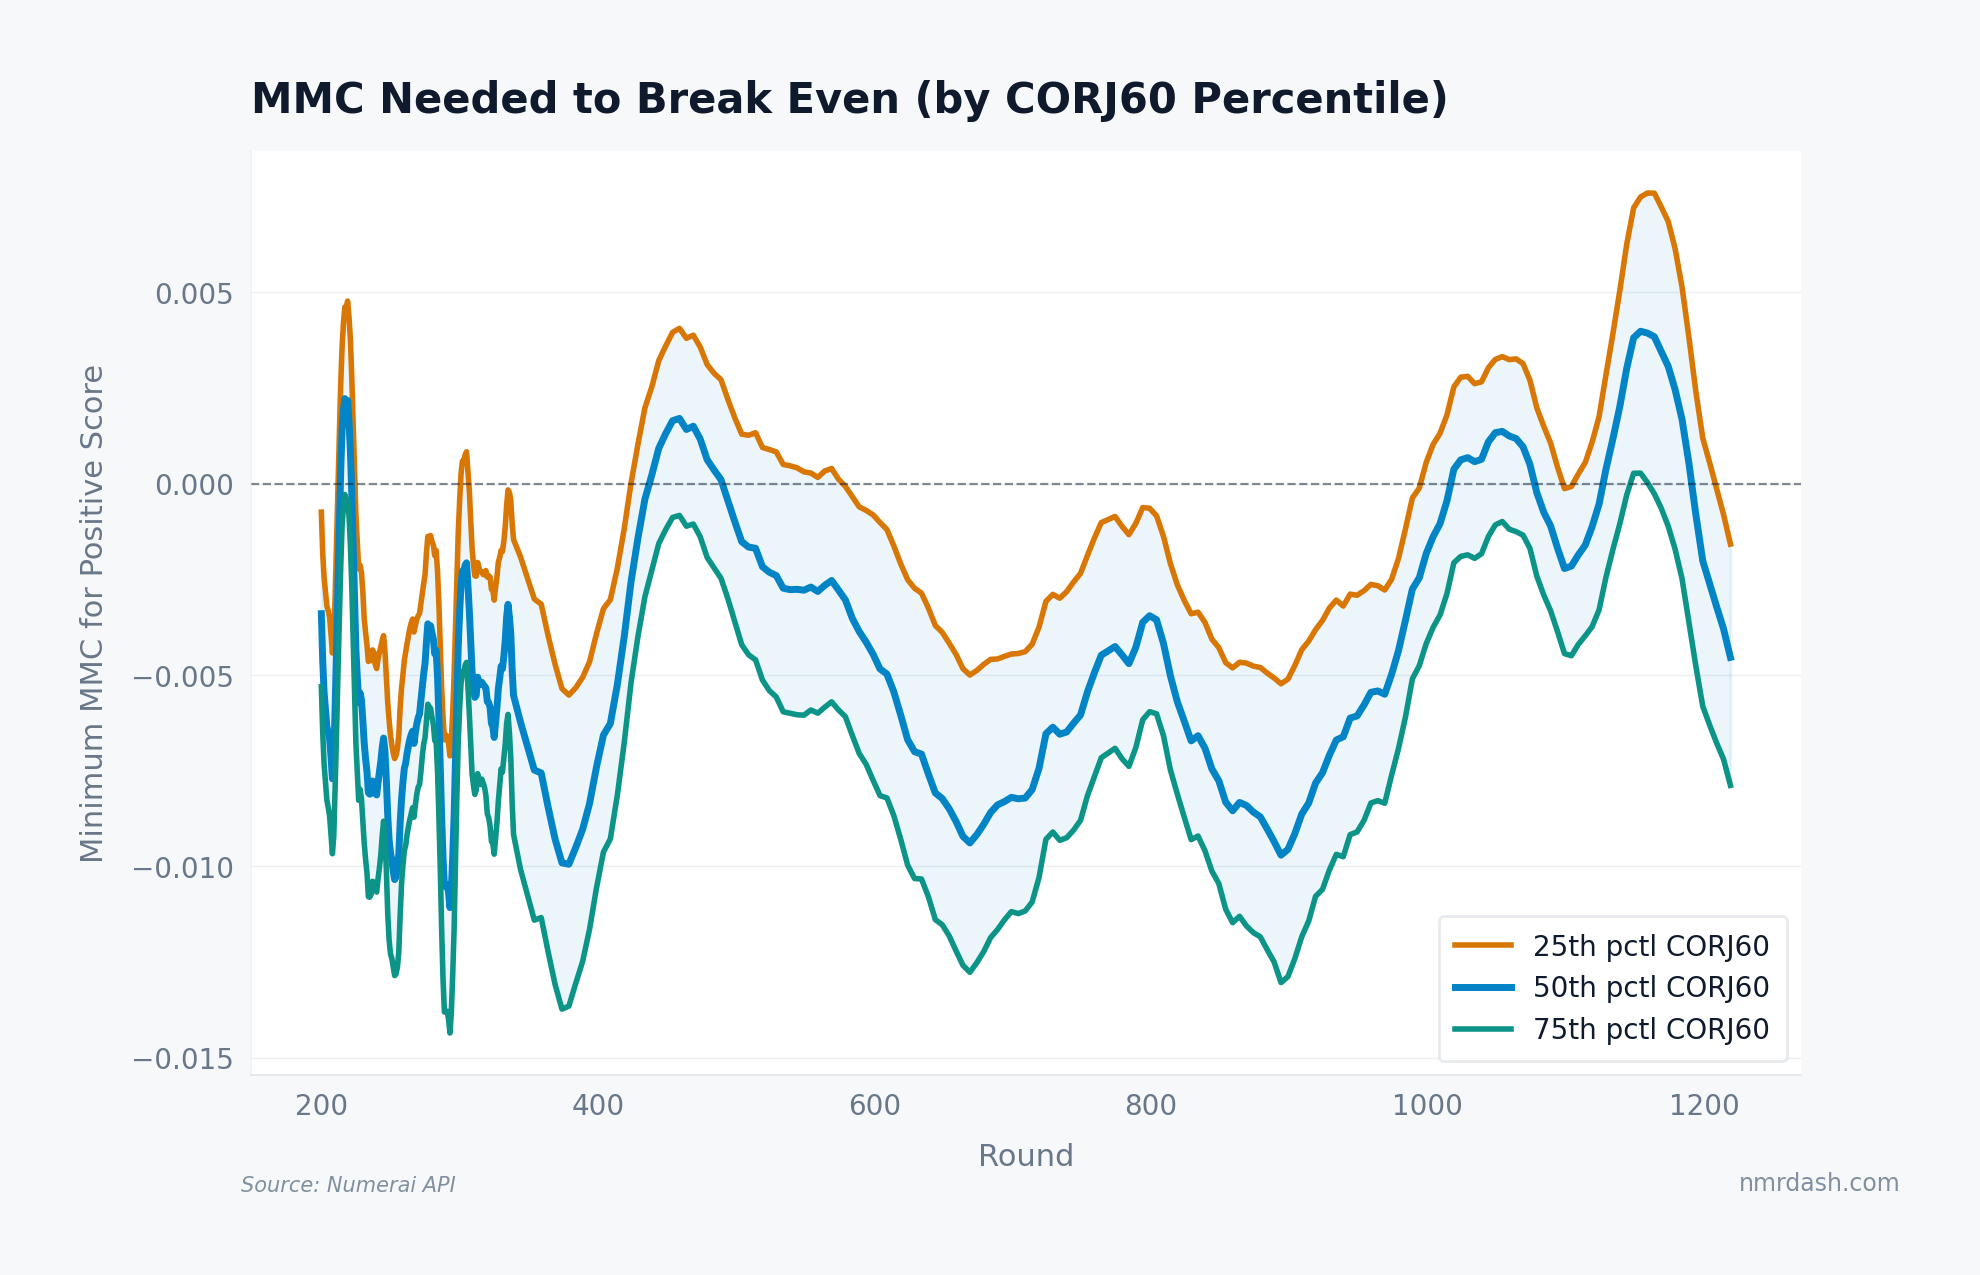
A model at the 25th percentile of CORJ60 usually needs positive MMC in harder stretches. At the median, the threshold hovers near zero. At the 75th percentile, a model has enough CORJ60 buffer to sustain mildly negative MMC and still post a positive score.
If your model's CORJ60 is below average, MMC is the offsetting metric. Predictions that add unique information to the meta-model earn positive MMC. Models that are uncorrelated with the crowd and directionally correct benefit most. Models that merely track the consensus contribute little unique signal and rely mostly on CORJ60 to stay profitable.
What a New Participant Needs in 2026
Here is what a minimum viable Numerai model looks like in 2026:
Beat the median on at least one axis. With 45-70% of models below break-even in recent rounds, median performance is not enough. You need above-average MMC, above-average CORJ60, or both.
Prioritize MMC if your correlation is weak. The break-even formula weights MMC four times as heavily as CORJ60 (2.0 vs 0.5). A model with poor correlation but strong meta-model contribution can still profit. The reverse — good correlation with negative MMC — faces a much narrower margin.
Size expectations to the payout factor. At a factor near 0.1, even a top-third model earns modest NMR per round. Compounding works, but over dozens of rounds, not days. The staking profitability data shows a median per-round return of 0.05% of stake. Track payout trends on the Trends page.
Expect regime dependence. In favorable regimes, 70% of models profit. In hostile ones, 70% lose. No model quality guarantees consistent profitability across all market environments. Understanding market regimes helps set expectations for drawdown periods.
The 2026 bar is harder than a simple positive-score test suggests: payout compression makes small edges worth less in NMR terms. The question is whether you can build a model that repeatedly clears the score threshold after costs, payout-factor compression, and regime shifts.