Reading The Numerai Leaderboard: A Column-By-Column Guide
What every column on the Numerai leaderboard means, with real distributions: rank 1 holds 0 NMR, top quintile medians +36% return, bottom quintile -28%.
nofle_17 has held rank 1 on the Numerai leaderboard every single day of the last 90 — and it has zero NMR staked. Across those 90 days only 16 distinct usernames have appeared anywhere in the top 10. Three of them (nofle_17, nofle_16, nofle_23) share an owner and occupy the entire podium. Meanwhile rank 26, reputation, staked 28,471 NMR and posted a +121% one-year return without breaking the top 25. That gap between "what gets ranked" and "what gets paid" is the single most misunderstood thing about the leaderboard, and it is because the column you are sorting by is MMC reputation, not stake or returns.
This post walks every column you will see (rank, NMR staked, 52-week return, reputation scores) using the snapshot from 2026-04-28. The goal is a quick mental model: if you land at rank N, what stake, return, and reputation should you expect?
Stake is loosely correlated with rank
Median stake decays by well over an order of magnitude across the leaderboard, but the rank-stake link is much weaker than newcomers assume.
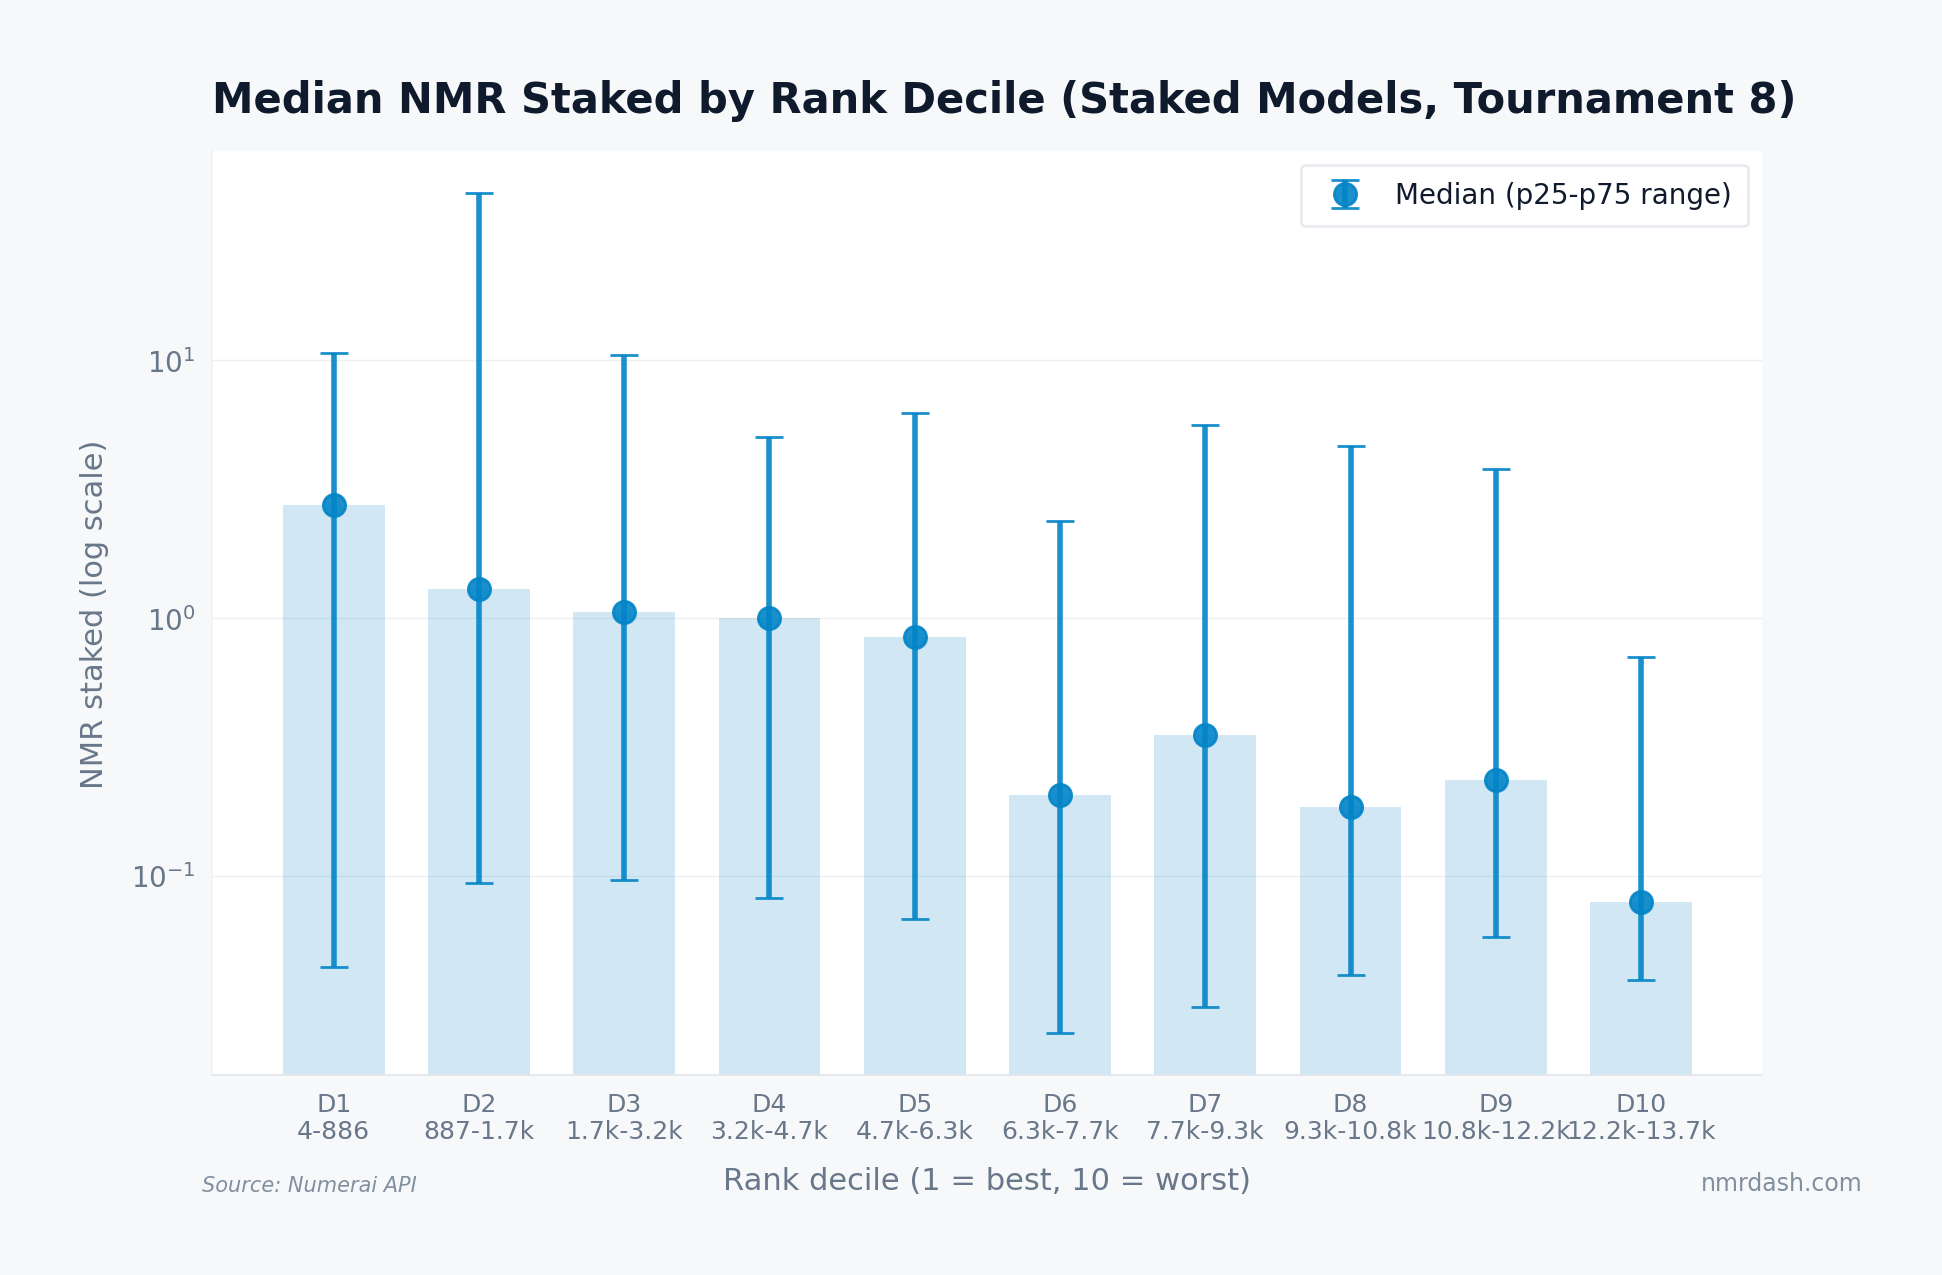
Among the 4,782 staked models, the top decile (ranks 4 to 886) carries a median stake of 2.0 NMR with an interquartile range of 0.07 to 19.2 NMR. The bottom decile (ranks 12,172 to 13,713) sits at a median of 0.08 NMR. The largest individual stake on the entire leaderboard, shatteredx at 107,099 NMR, sits at rank 965, well outside the top 100. Of the top 100 ranks, only 68 have any stake at all, and together they hold just 4.4% of the tournament's 779,502 NMR. Stake is a useful signal of skin in the game, but it is not what the leaderboard sorts by, and a high rank does not imply a large stake.
52-week return is where rank quality is visible
If you want to know whether a high rank actually means good performance, the cleanest column is return_52w.
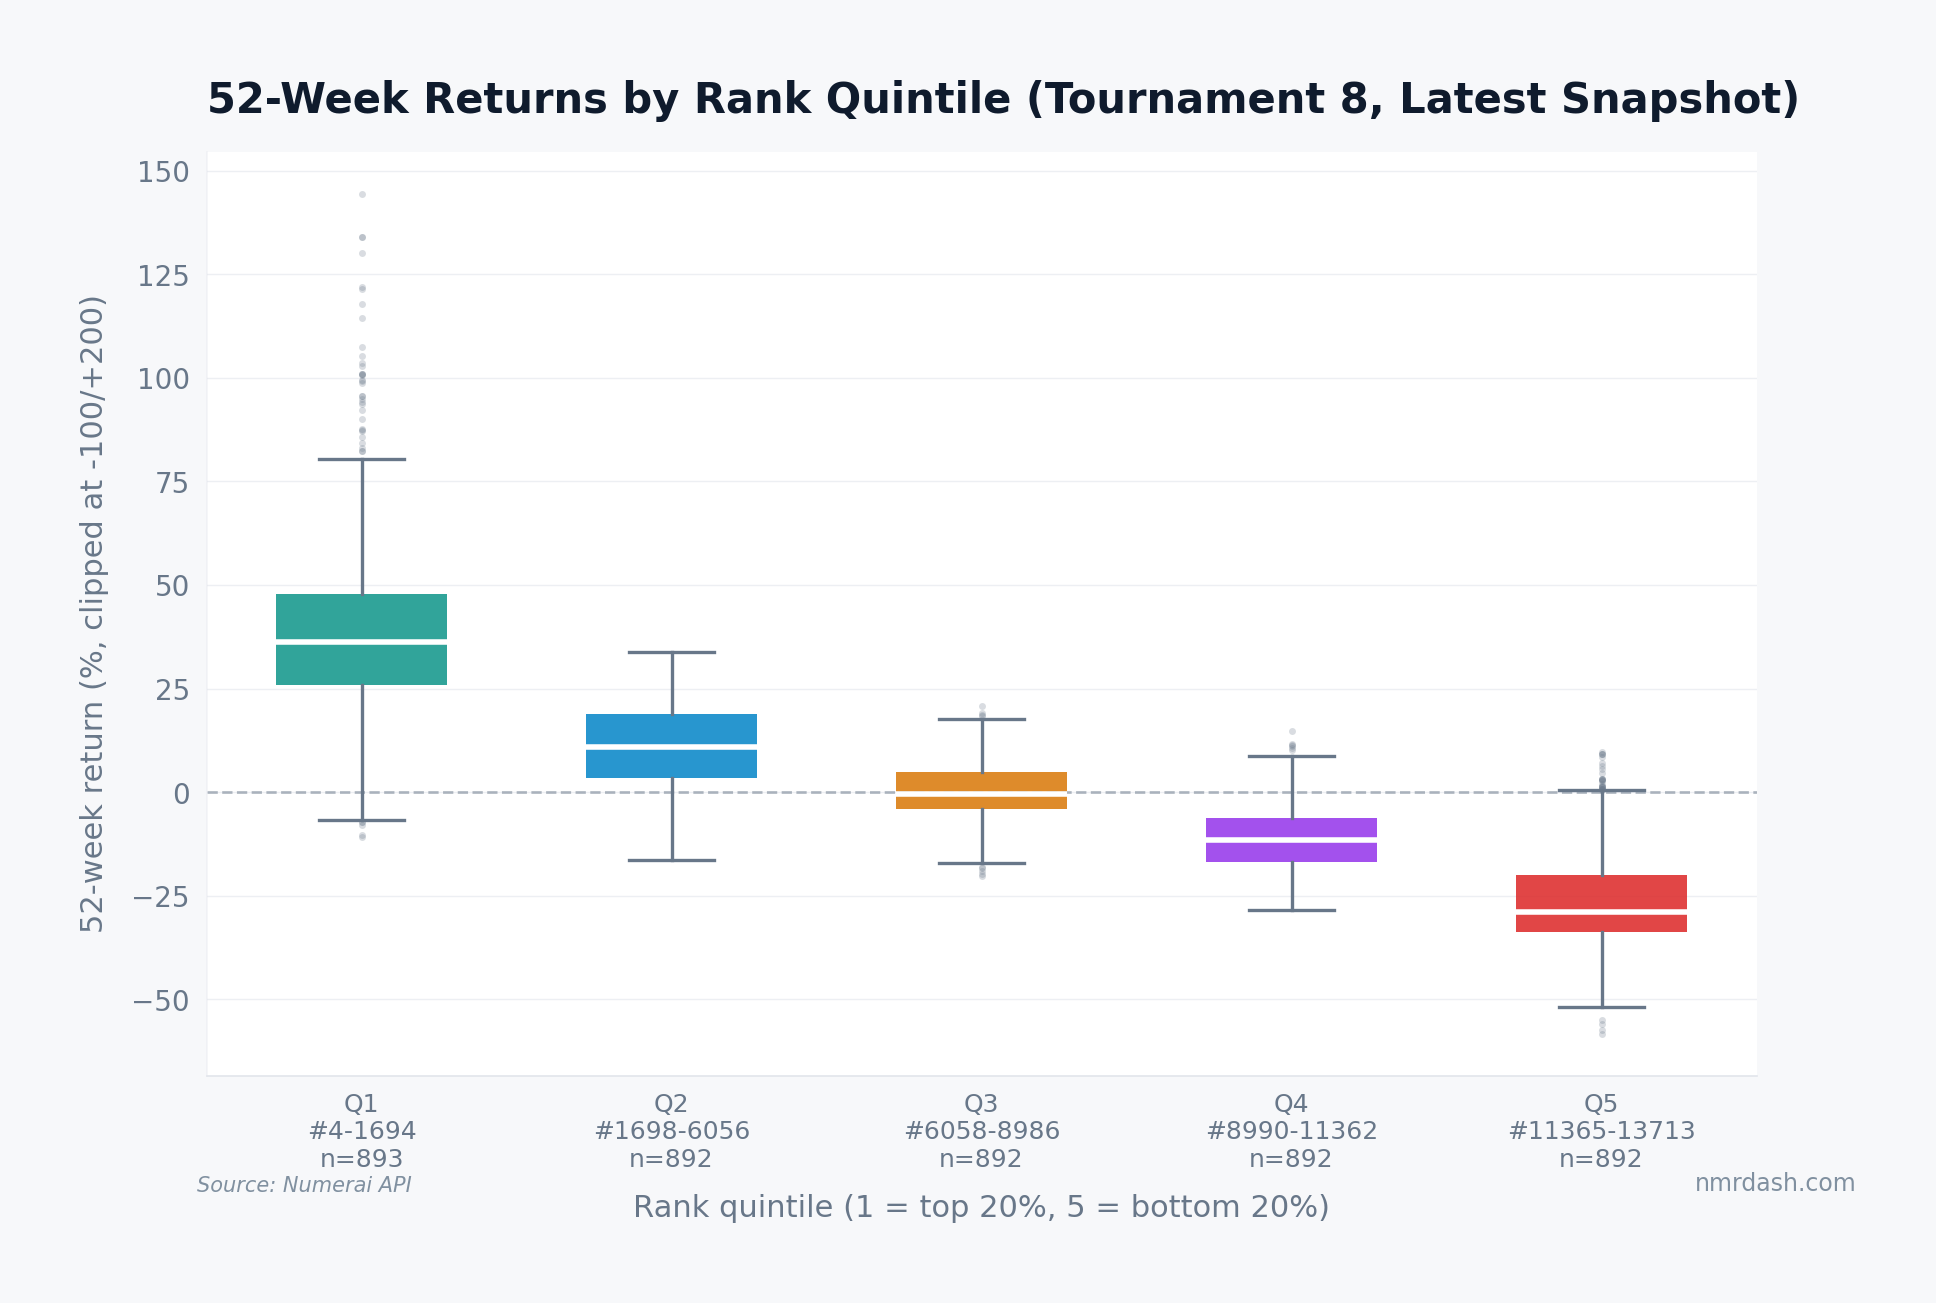
The pattern is monotone. Q1 (top 20% of ranks) posts a median 52-week return near +36% with the IQR sitting between +28% and +48%. Q2 drops to roughly +10%, Q3 already sits slightly negative near -2%. Q4 lands at about -12%, and Q5 (bottom 20%) at roughly -28%. The spread tightens as you descend. This is the return gradient associated with the ranking: top-ranked models have much better recent returns, but rank is still a reputation sort, not a direct return sort.
Reputation is the column that sets the order
The leaderboard's primary sort key is MMC reputation, a rolling 20-round average of meta-model contribution. Looking at the top 100 versus the bottom 100 makes the gap obvious.
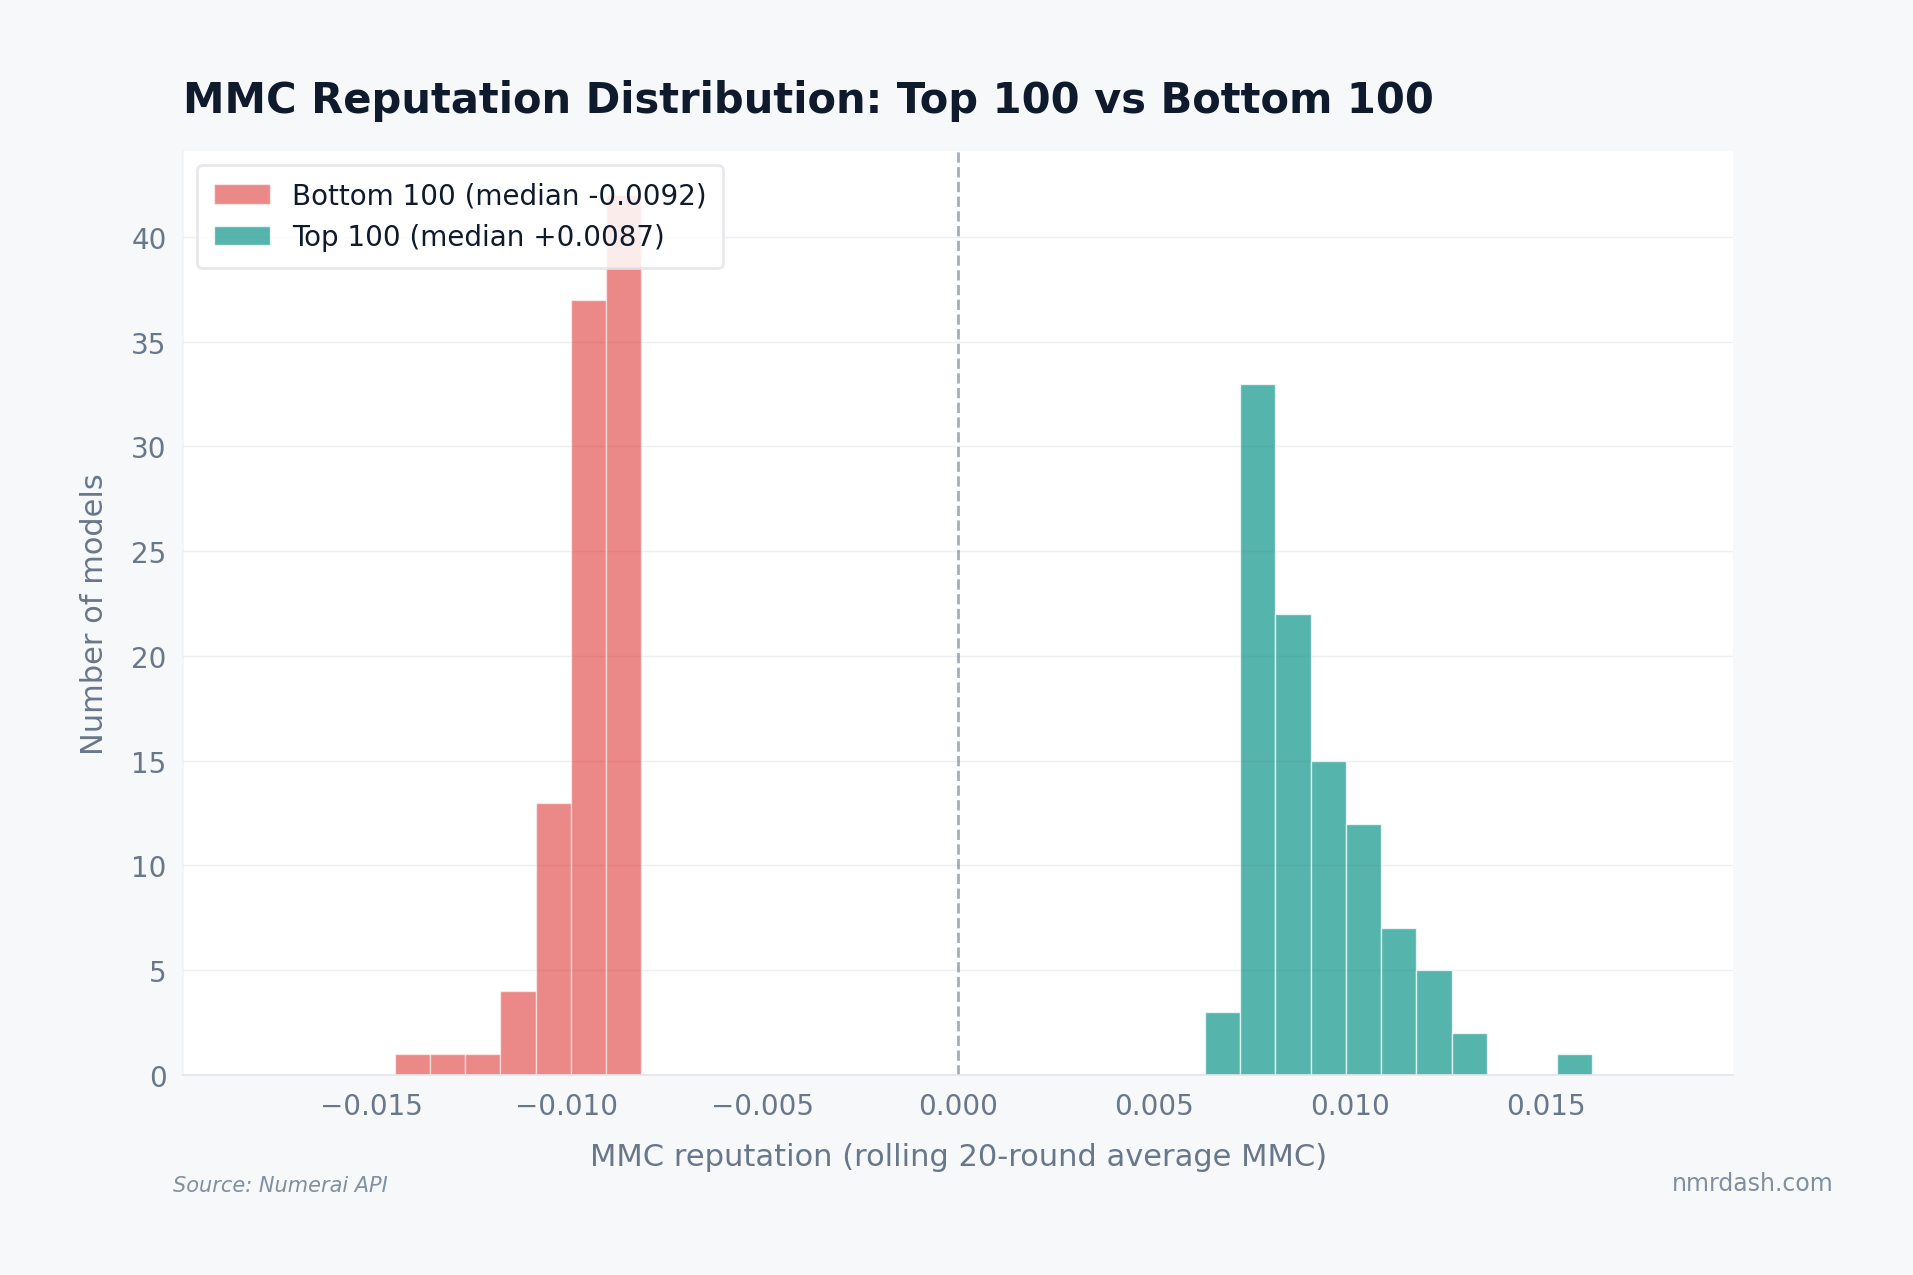
Two distributions, no overlap. The top 100 cluster between MMC reputation +0.007 and +0.016, with a median of +0.0087. The bottom 100 cluster between -0.009 and -0.014, with a median of -0.0092. Numerai pays models for raw MMC each round; the leaderboard surfaces those who consistently put up positive numbers. Reputation values look small because they are average per-round contributions. Accumulate +0.0087 across 50 rounds and it can compound into visible payouts, depending on stake size and payout factor.
Reputation columns disagree more than you might expect
The leaderboard ships four reputation columns (MMC, CORJ60, FNCv3, and BMC) and they capture different angles of the same model.
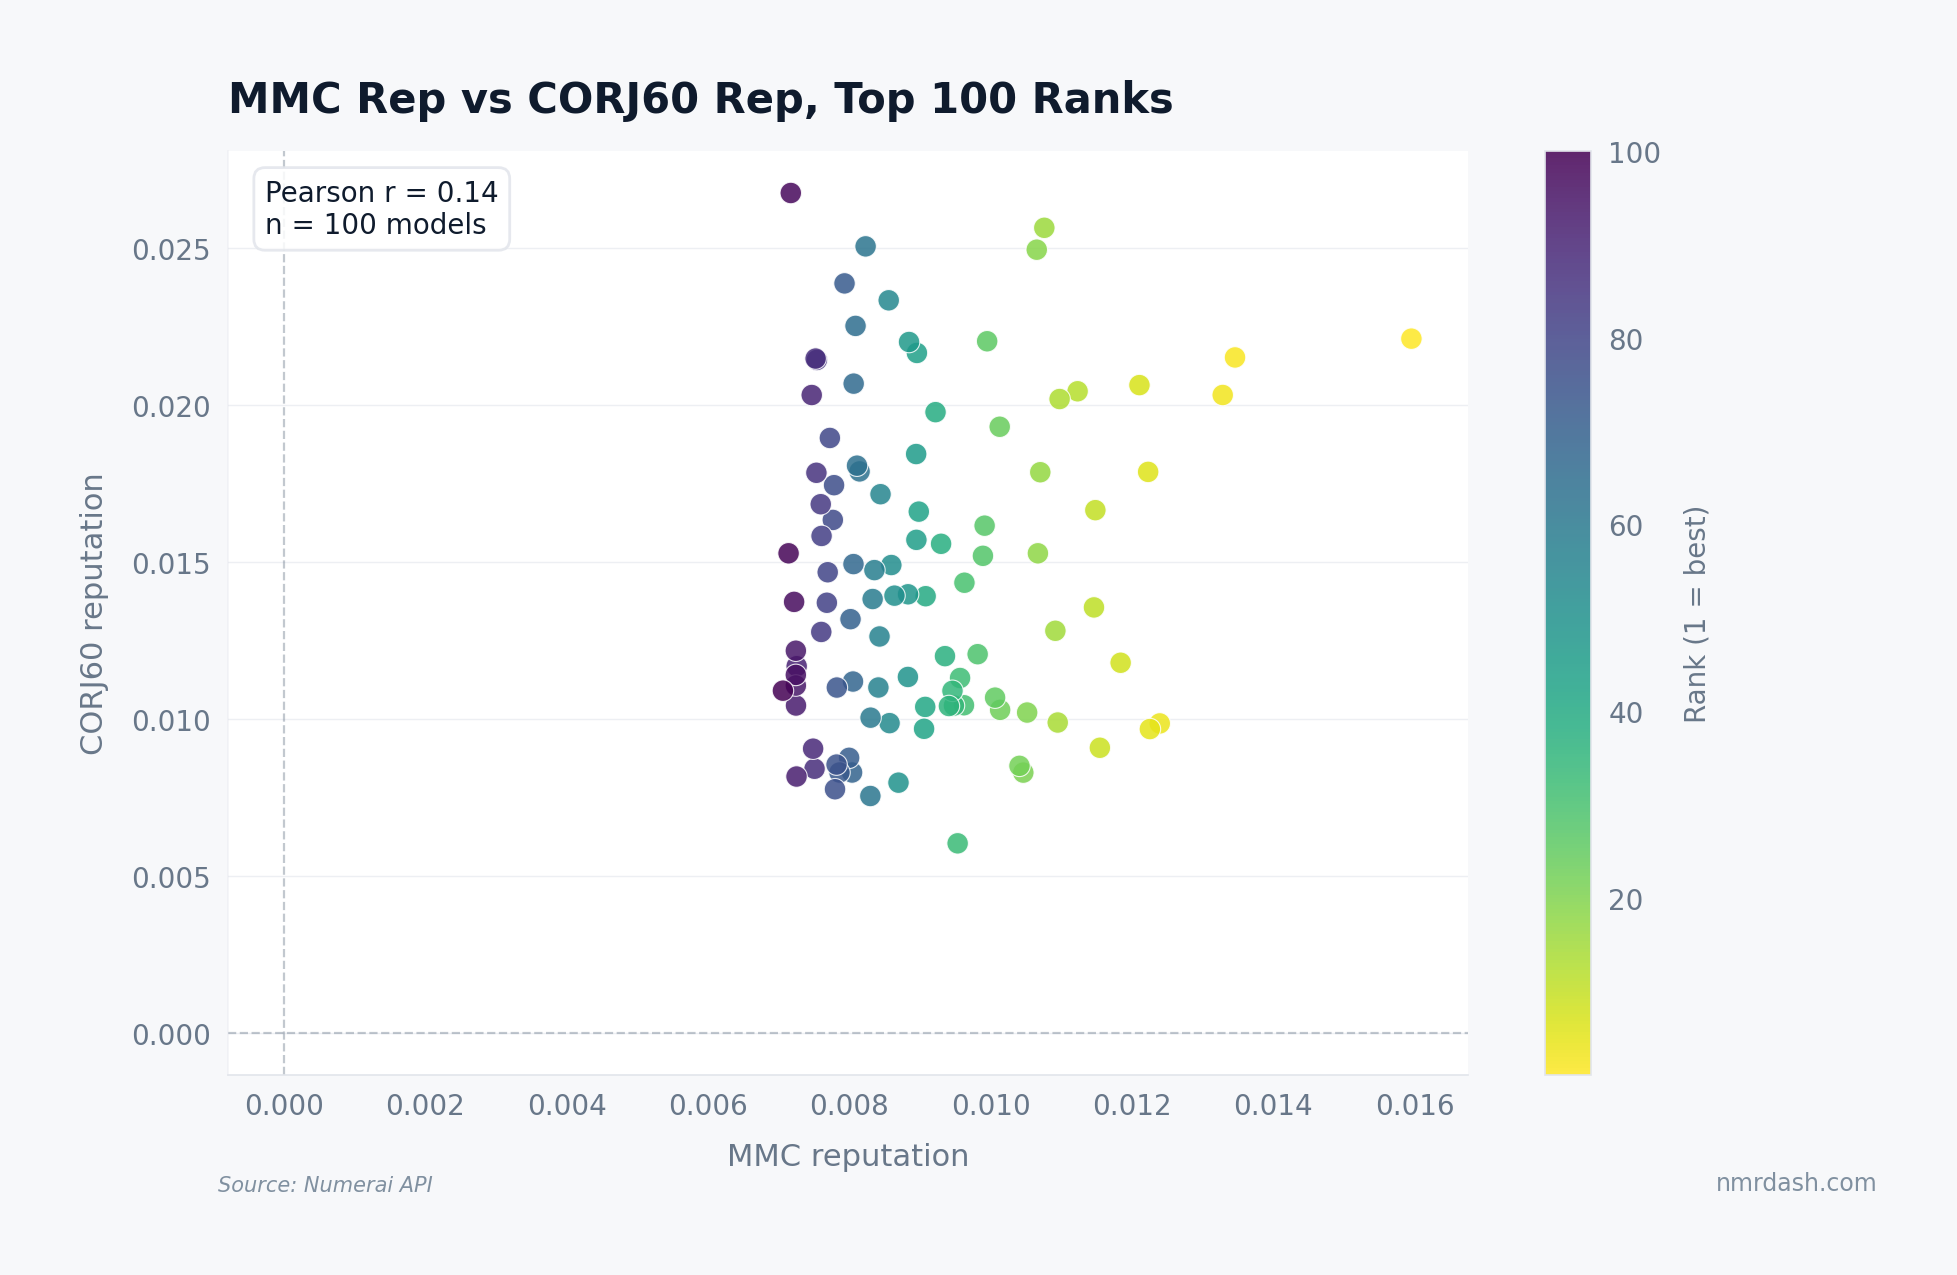
Within the top 100, MMC reputation and CORJ60 reputation correlate at only r = 0.14. A model can post elite MMC (alpha against the meta-model) while running middling CORJ60 (raw correlation with targets), and the reverse is also common. pako76 at rank 16 has the second-highest CORJ60 in the top 100 at 0.0257, but only 0.0107 in MMC. The reputation columns measure different scoring axes, so a stake-based ranking on the Models page can highlight models whose strengths differ from the leaderboard's MMC sort.
What to take from a row
A useful read of any leaderboard row in Tournament 8 looks like this. Check the rank to gauge MMC reputation tier; top 1,000 means consistent positive MMC over 20 rounds. Check nmr_staked separately because it is independent of rank. The model reputation at rank 26 with 28,471 NMR is the only model where high rank and high stake coincide near the top. Check return_52w for actual recent performance, with anything above +25% being top-quintile territory. Then cross-reference MMC and CORJ60 reputation to see which scoring axis the model wins on.
The leaderboard is not a list of who has earned the most NMR or who staked the most. It is a list of who has produced the most consistent positive contribution to the meta-model. The corollary: the top is far more stable than the page makes it look. Only 16 distinct usernames have touched the top 10 in 90 days, and a single account family holds ranks 1-3 unchanged. If you are not in that incumbent set, the realistic target is a top-1,000 reputation tier and a top-quintile 52-week return — that is the band where the leaderboard signals "this is paying" rather than "this is famous." For other slices like payout efficiency by stake tier, retention, and age, the Models page and Trends page cut the same data along complementary axes.