Leaderboard Earthquake Index: Rank Volatility in Numerai
The median Numerai model shifts 30 rank positions per day. The 95th percentile shifts 217. Models staking 100-1K NMR hold the steadiest ranks of any tier.
The Numerai leaderboard updates daily, and rank volatility is the signal most participants overlook. On a quiet day the top 50 looks the same as yesterday. On a loud day, hundreds of models swap places. That churn carries information about tournament health, market conditions, and model quality that a static rank snapshot misses.
This post builds a seismograph for the leaderboard. By measuring aggregate rank changes day-over-day, we identify earthquake days, check whether they cluster, test for correlation with NMR price, and compare rank stability across stake tiers.
The Earthquake Index
For each consecutive pair of daily snapshots, take every model present on both days and compute the absolute change in rank. Average those changes across all models. The result is a single number per day: the earthquake index.
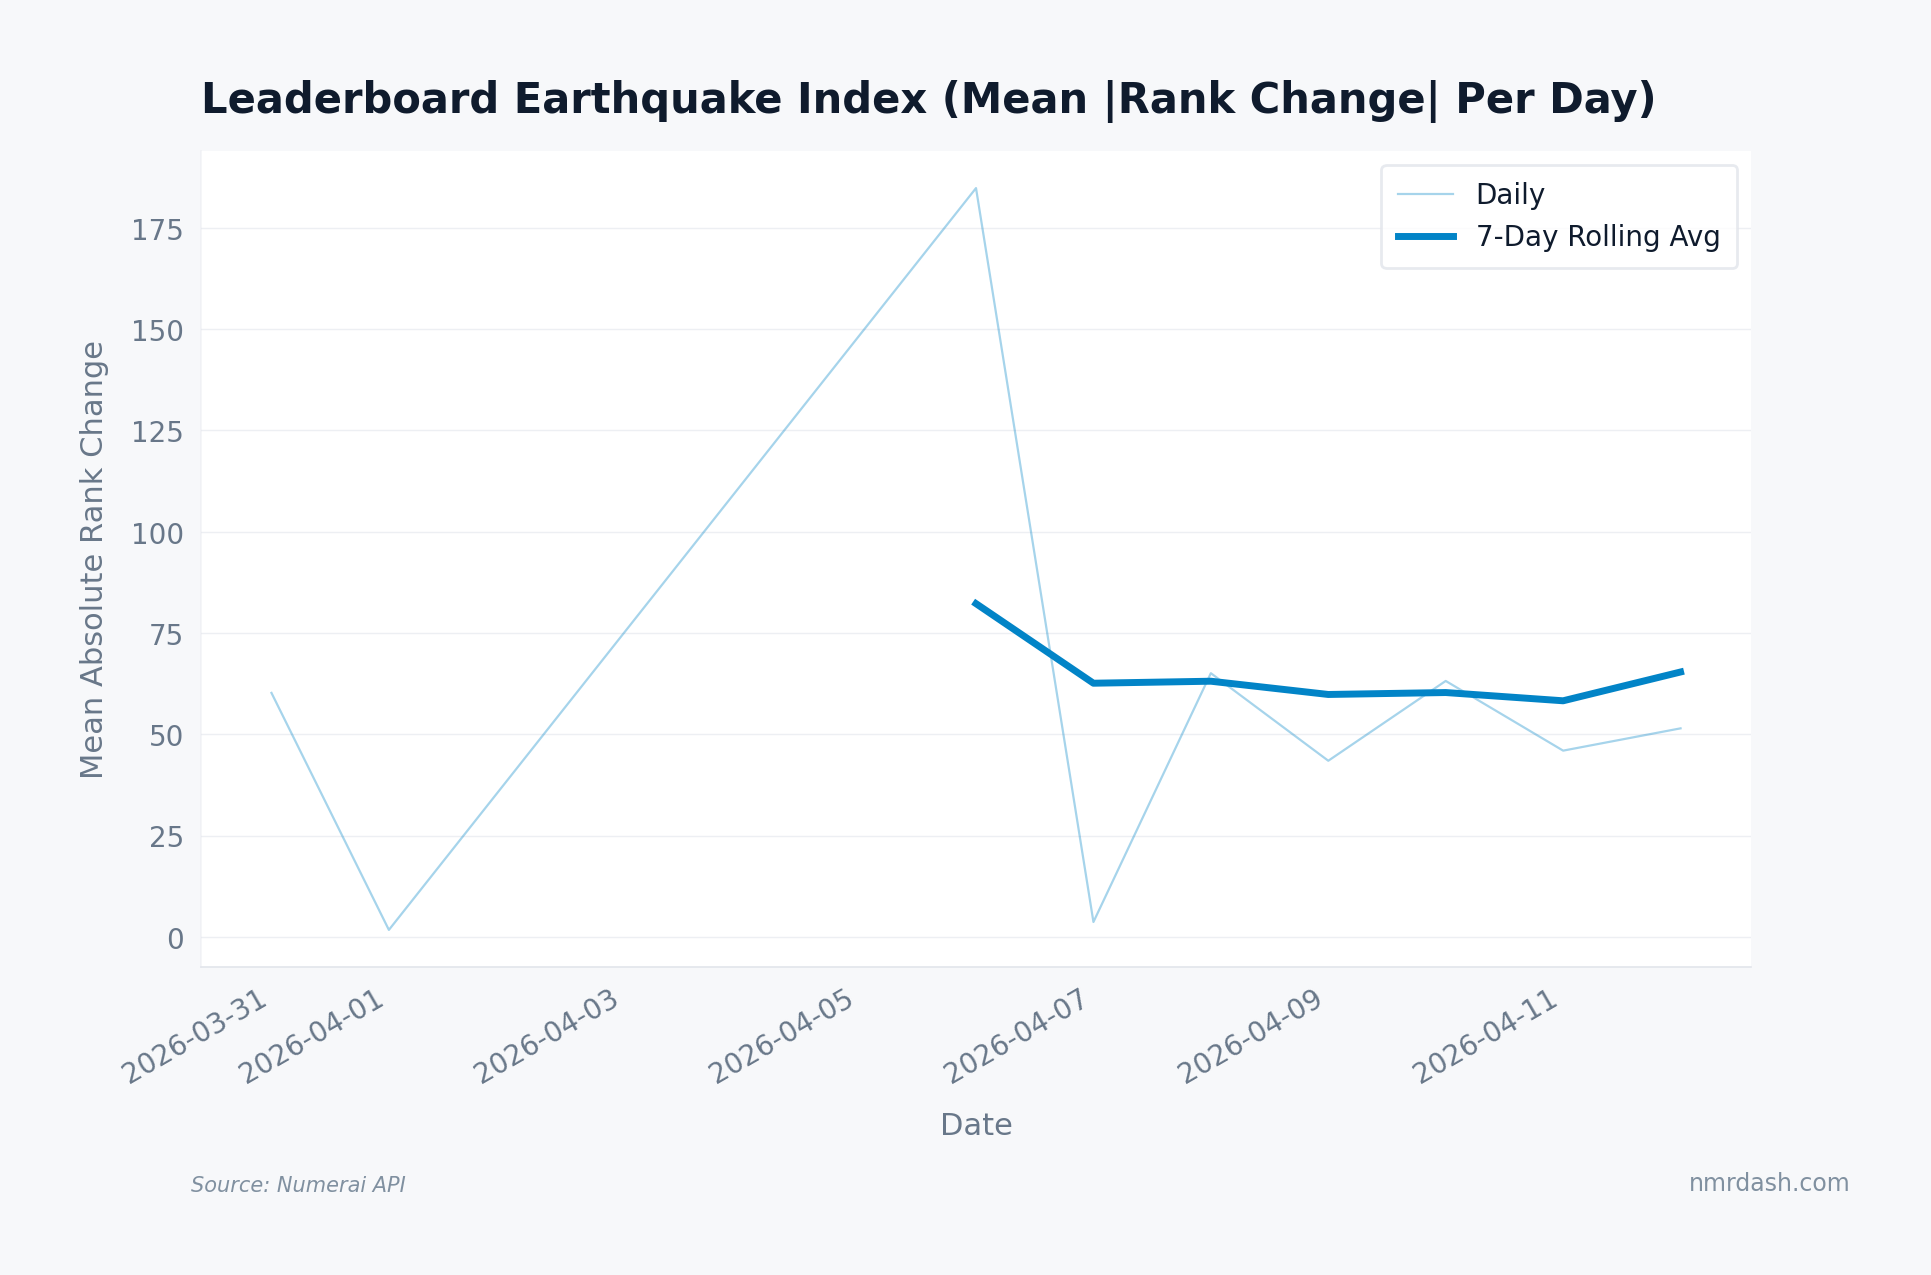
Even across a short window of daily snapshots, the index swings from near zero to more than 180 mean positions per day. On calm days the typical model barely moves. On the worst days the average model jumps more than 150 ranks. Those spikes cluster into multi-day episodes rather than scattering randomly, suggesting a persistent external pressure across consecutive snapshots.
The 7-day rolling average makes regime transitions visible. When it stays above 100, leaderboard ranks are in a sustained turbulent phase; treat individual rank changes cautiously until the episode fades.
The Shape of Rank Changes
How extreme are individual model-day rank changes? The histogram below aggregates every rank change across all models and all days in the sample.
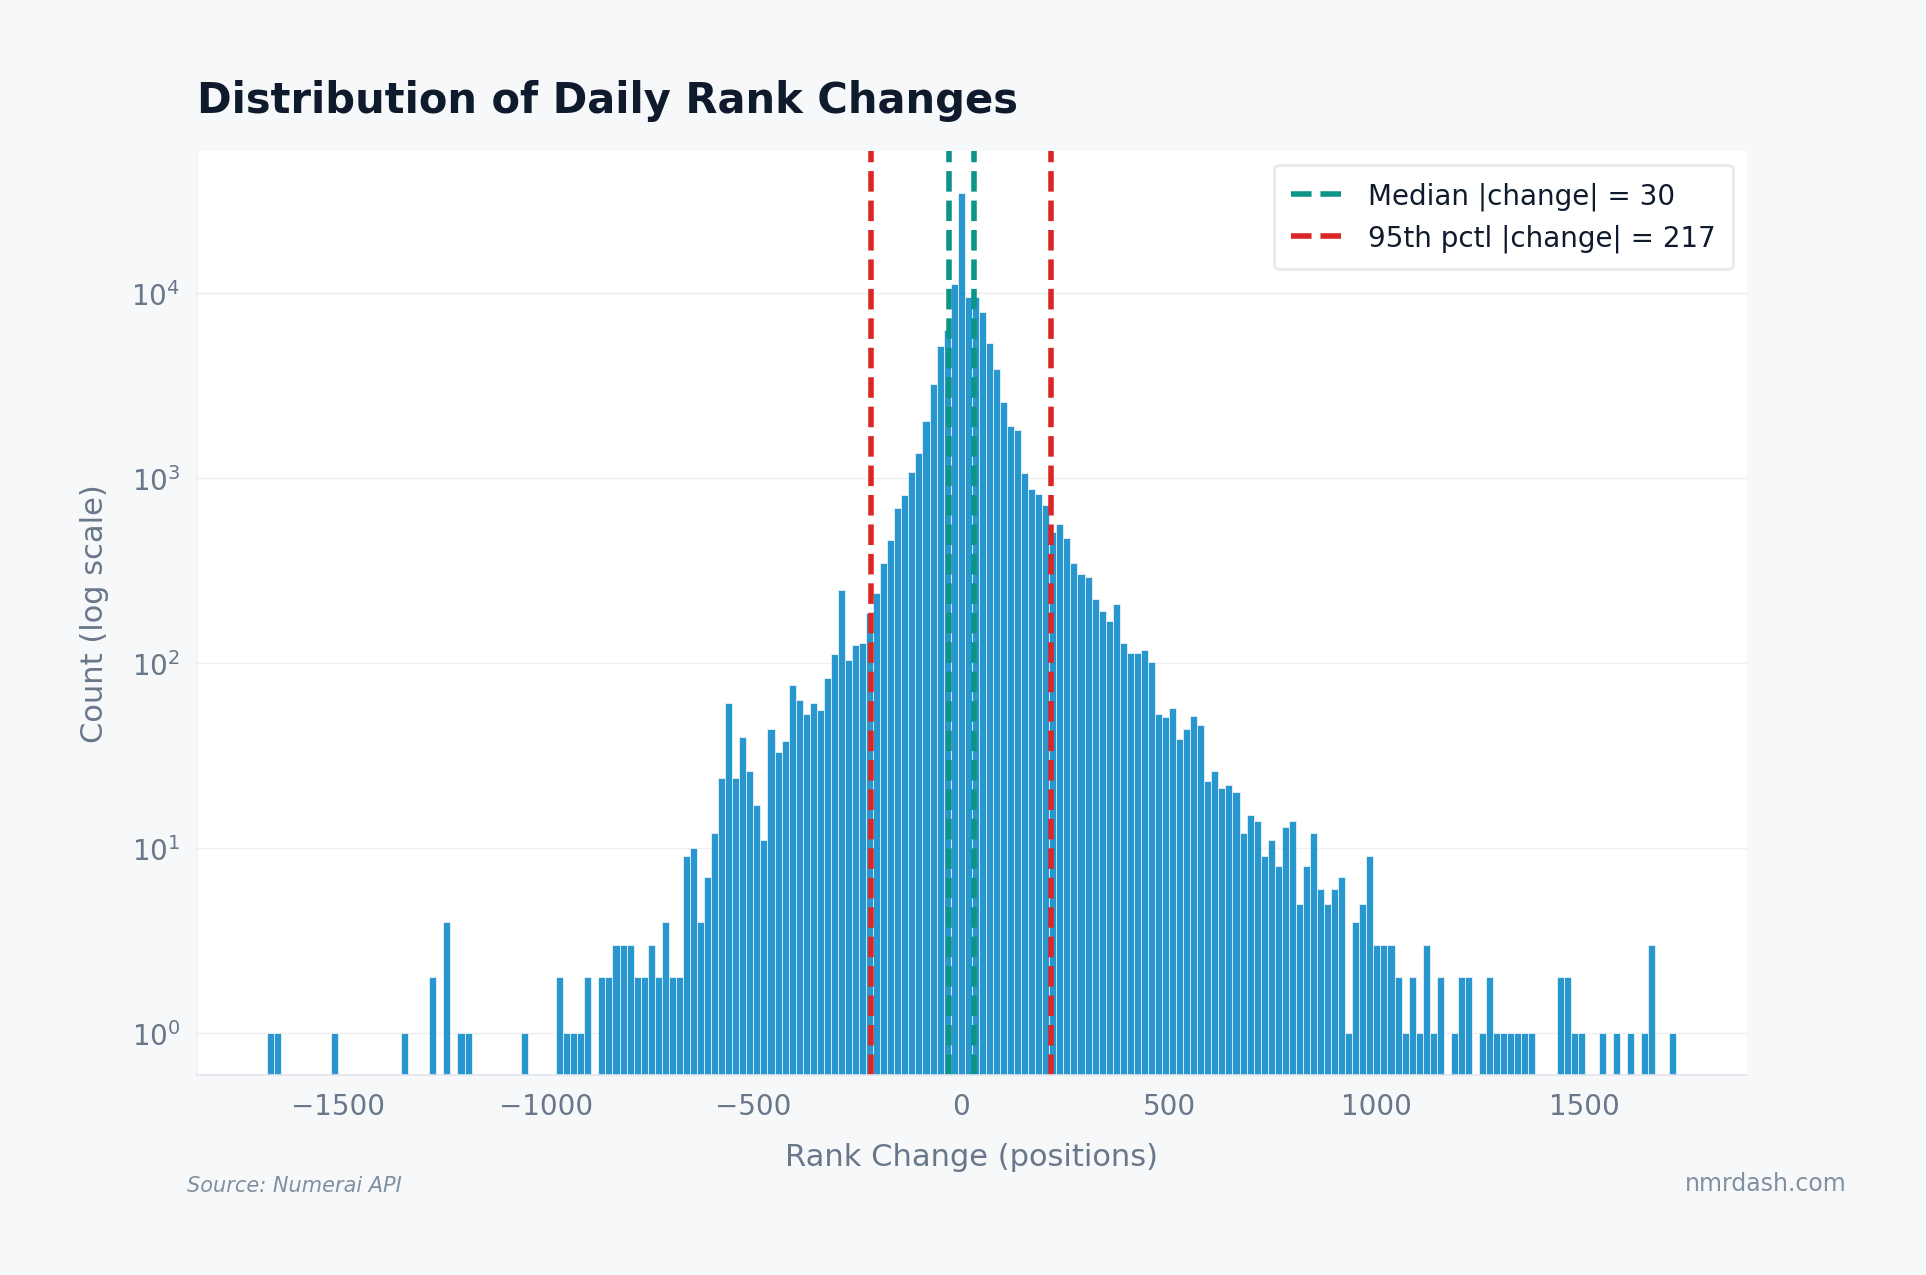
The distribution peaks sharply around zero but carries heavy tails. The median absolute change is 30 positions — a gentle drift. The 95th percentile is 217 positions, and outliers extend past 1,500. A few models gain or lose more than a thousand ranks in a single day.
The log-scale y-axis makes clear that extreme rank jumps are not isolated anomalies. If your model drops 300 ranks overnight, that move is rare but structurally normal.
The tails are roughly symmetric: large upward and downward jumps occur at similar rates. Rank is zero-sum, so every loss by one model is a gain by another.
Do Rank Earthquakes Track NMR Price?
Models predict equities, but NMR trades with crypto. Are rank earthquakes connected to token price moves?
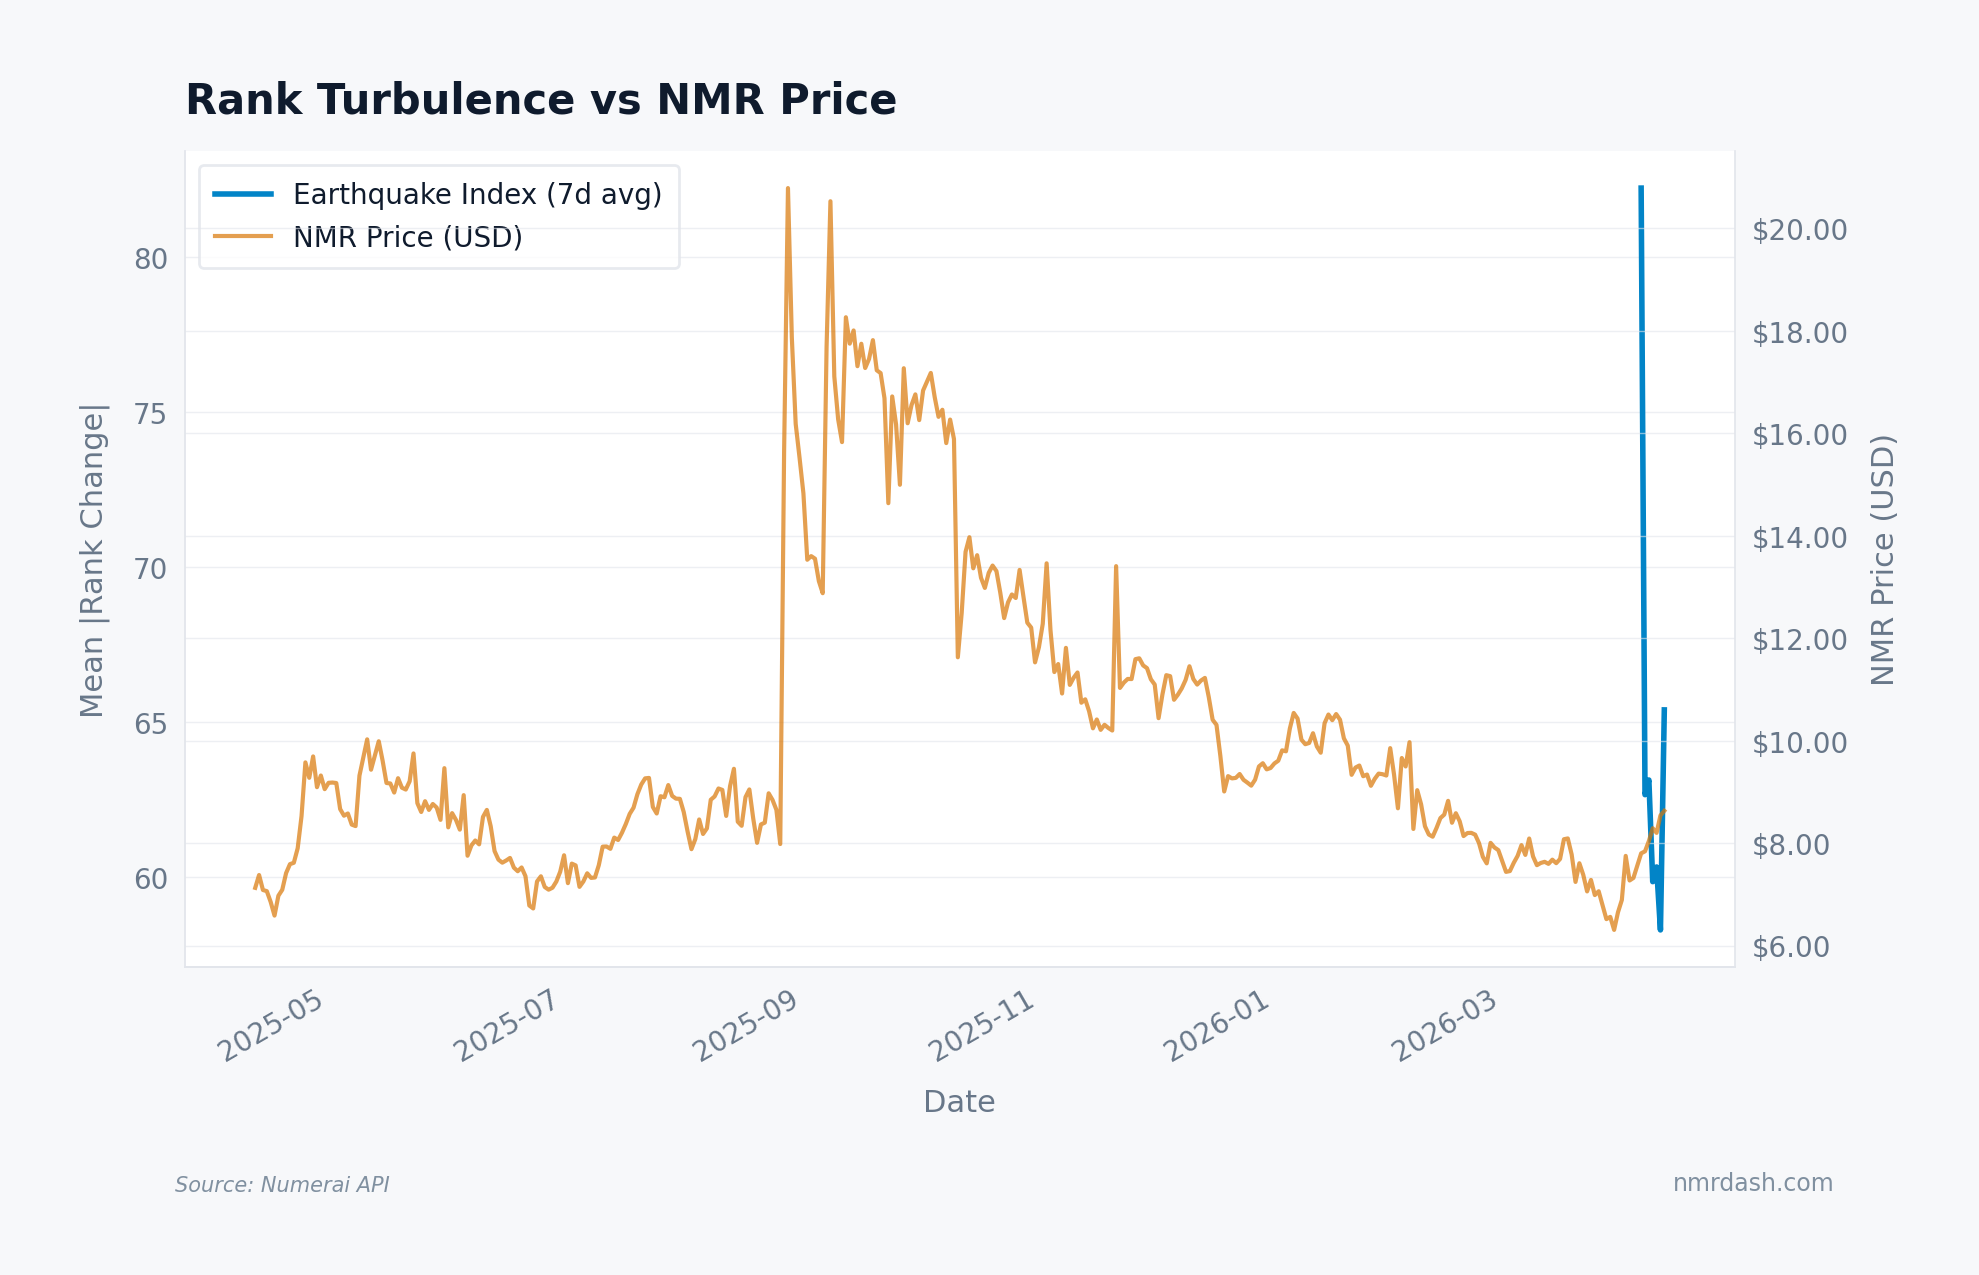
The relationship is weak. NMR ran a full boom-bust cycle over the charted year — spiking above $20 in September 2025, then sliding back toward $8 by spring 2026 — while the earthquake index, plotted over the most recent snapshot window, swings from calm to violent within days against that slow price drift. Turbulence shows no tendency to line up with the token's trend.
This makes sense mechanically. Rank turbulence is more plausibly tied to equity-market conditions, such as factor rotations, volatility shocks, and sector leadership shifts, than to NMR token price. NMR price tracks crypto sentiment. They share some macro exposure but measure different things. A regime shift in equities can scramble the leaderboard without moving NMR at all.
Do not use NMR price as a proxy for tournament difficulty. Track the earthquake index directly on the trends page. For token exposure analysis, see NMR token economics.
Rank Stability by Stake Size
Do bigger stakers hold steadier ranks? If experienced participants commit more capital and run better-tuned models, that should show up as lower daily rank volatility.
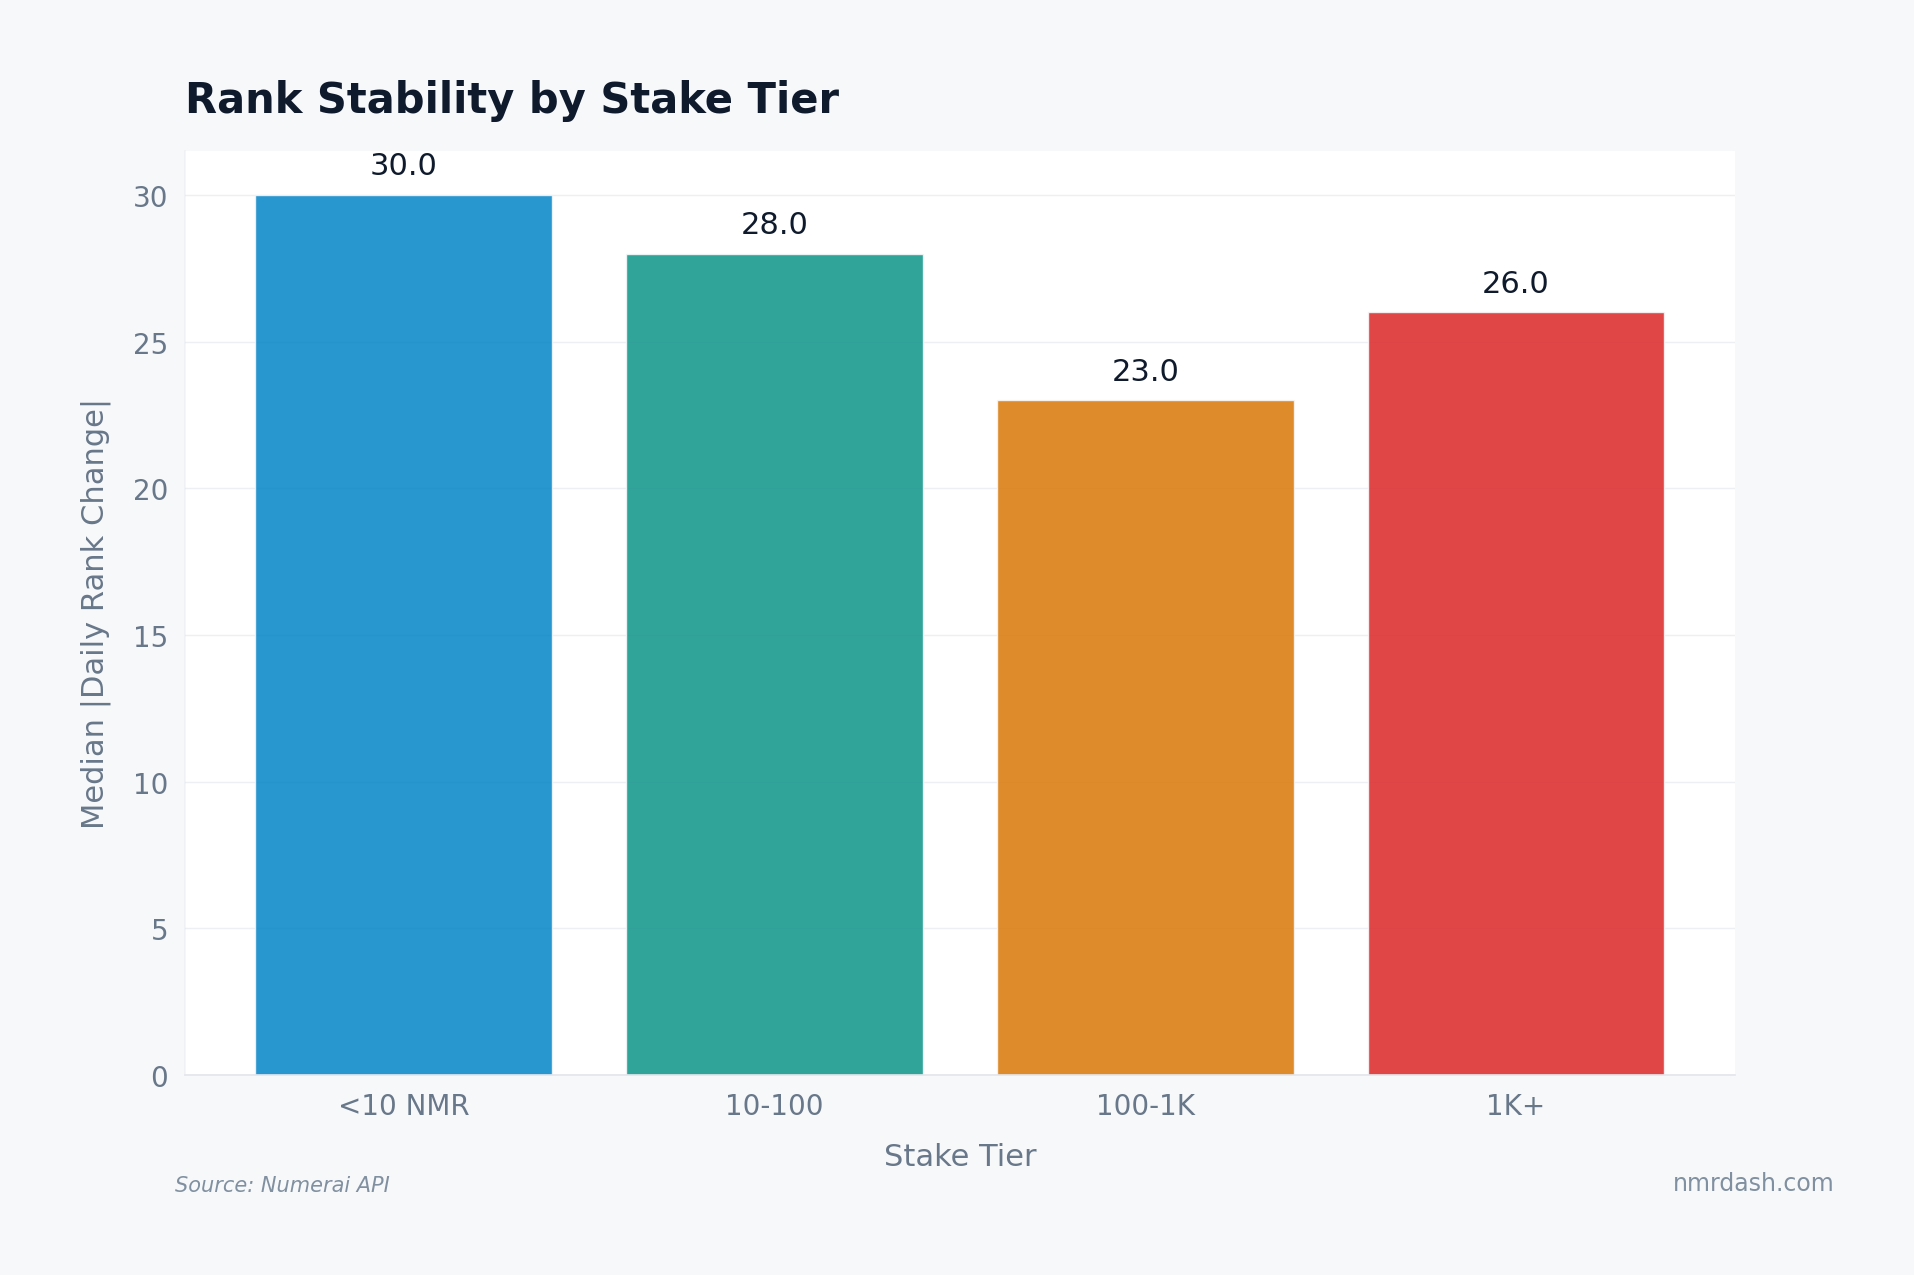
The 100-1K NMR tier posts the lowest median daily rank change at 23 positions, compared to 30 for models staking under 10 NMR — roughly 23% less daily churn.
The 1K+ tier bounces back up to 26, slightly above the 100-1K group. The largest stakers may run models with aggressive signal targets that accept more rank variance for higher expected payout. The smaller sample size in this tier could also amplify outlier days.
The relationship between stake size and rank stability is not monotonic. The steadiest models sit in the 100-1K band; that tier may contain more mature models or less extreme strategies, but the chart does not identify the cause. For how stake sizes interact with payout mechanics, see the payout factor and round economics.
Practical Takeaways
The leaderboard looks static in a daily screenshot. It is not. The median model shifts 30 positions every day, and 5% of model-days involve jumps of 217+ positions. Those moves cluster into multi-day turbulent episodes.
NMR price does not predict rank earthquakes. Stake size offers modest insulation, with the 100-1K NMR tier the most stable. The earthquake index itself is the most direct measure of leaderboard calm or upheaval.
If your rank drops 200 positions overnight, check the earthquake index before diagnosing a model problem. If the whole leaderboard moved, the cause is systemic. If only your model moved, the cause is specific. The distinction changes what you should do next.